Chapter 3 Enrichment anaysis
To explore important biological significance or related biological pathway for each cluster, you can supply your own enrichment results with data frame format(two columns: cluster number and term name) or use enrichCluster to do batch enrichment analysis for each cluster.
3.1 Enrichment for non-model organisms
Adjust id.trans/toType/readable parameters if you have created your own orgdb object:
enrich <- enrichCluster(object = cm,
                       OrgDb = org.myorg.eg.db,
                       type = "BP",
                       idTrans = F,
                       toType = "GID",
                       readable = F,
                       pvalueCutoff = 0.5,
                       topn = 5)
You can set TERM2GENE and TERM2NAME if you have data frame with pathway-gene and pathway-pathwat name data:
3.2 Own enrichment data
Here we load an example enrichment data frame:
# load term info
data("termanno")

# check
head(termanno,4)
#   id                               term
# 1 C1              developmental process
# 2 C1   anatomical structure development
# 3 C1 multicellular organism development
# 4 C2                 system development
Add enrichment results annotation beside the heatmap for each cluster:
# anno with GO terms
pdf('testHTterm.pdf',height = 10,width = 10)
visCluster(object = ck,
           plotType = "both",
           column_names_rot = 45,
           annoTermData = termanno)
dev.off()
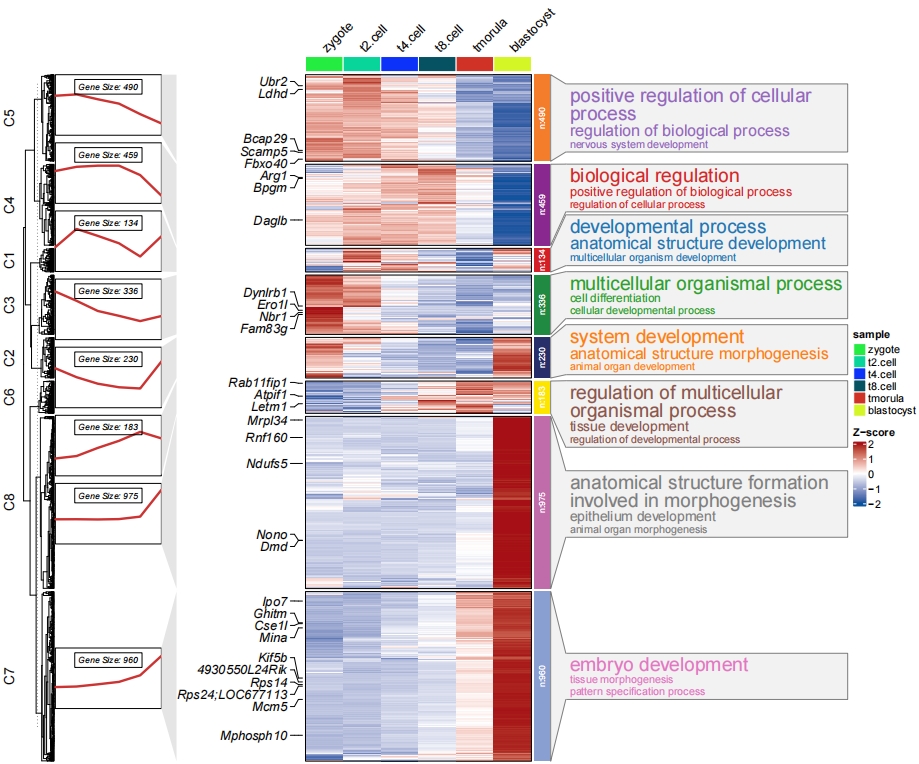
Put the line anntation to the left:
# change the line annotation side
pdf('testHTtermCmls.pdf',height = 10,width = 10)
visCluster(object = cm,
           plotType = "both",
           column_names_rot = 45,
           annoTermData = termanno,
           lineSide = "left")
dev.off()
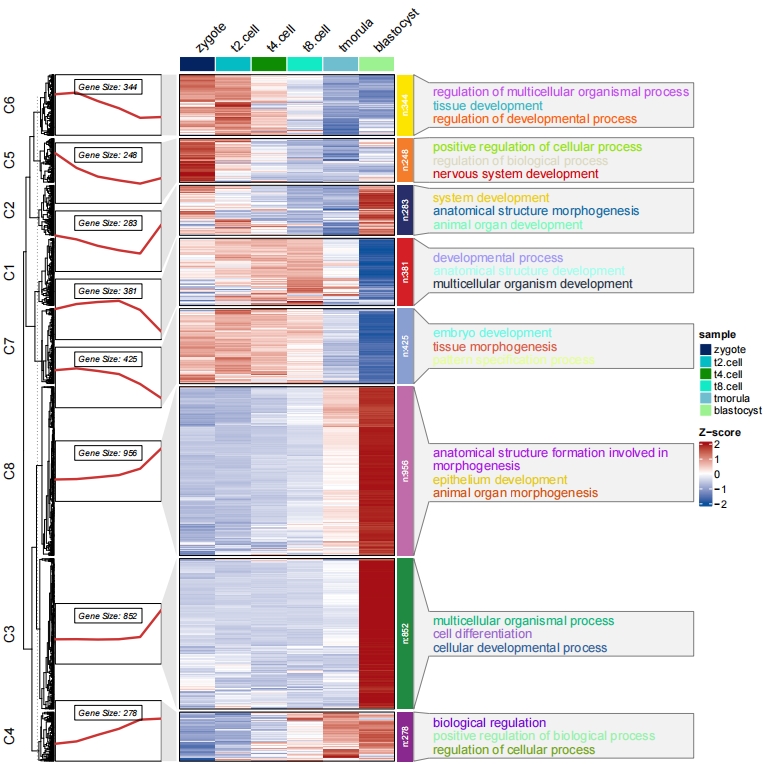
Remove the dend tree:
# remove tree
pdf('testHTtermCmlsrt.pdf',height = 10,width = 10)
visCluster(object = cm,
           plotType = "both",
           column_names_rot = 45,
           annoTermData = termanno,
           lineSide = "left",
           show_row_dend = F)
dev.off()
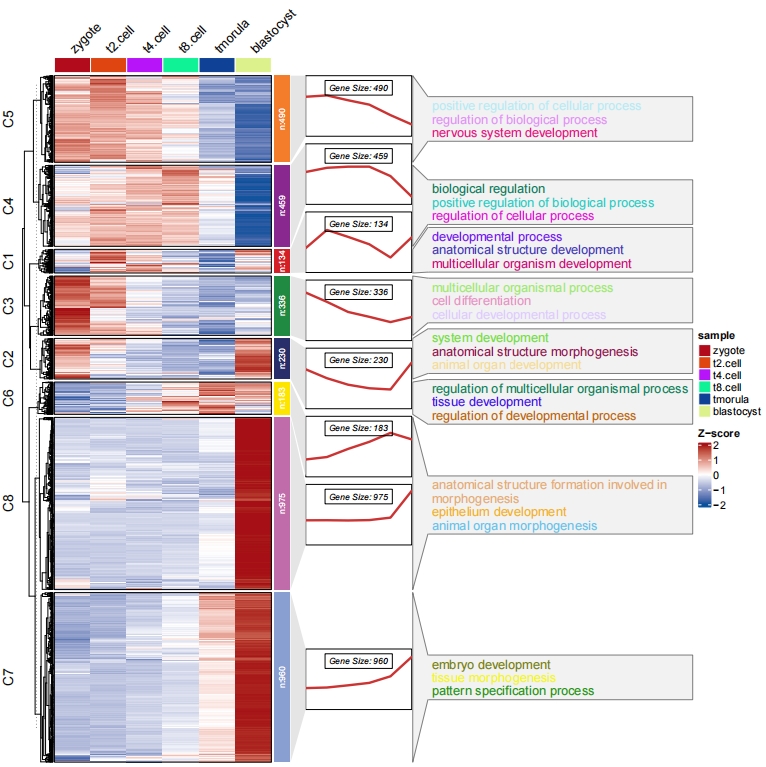
You can supply enrichment data with pvalue column to show in plot, the pathway label size reflects the relative pvalue:
# load GO term data
data("termanno2")

# check
head(termanno2,3)
#   id                               term     pval
# 1 C1              developmental process 3.17e-69
# 2 C1   anatomical structure development 1.44e-68
# 3 C1 multicellular organism development 1.36e-66

# adjust term colors and text size
pdf('termlfts.pdf',height = 10,width = 12,onefile = F)
visCluster(object = ck,
           plotType = "both",
           column_names_rot = 45,
           markGenes = markGenes,
           markGenesSide = "left",
           genesGp = c('italic',fontsize = 12,col = "black"),
           annoTermData = termanno2,
           lineSide = "left",
           goCol = rep(ggsci::pal_d3()(8),each = 3),
           goSize = "pval")
dev.off()
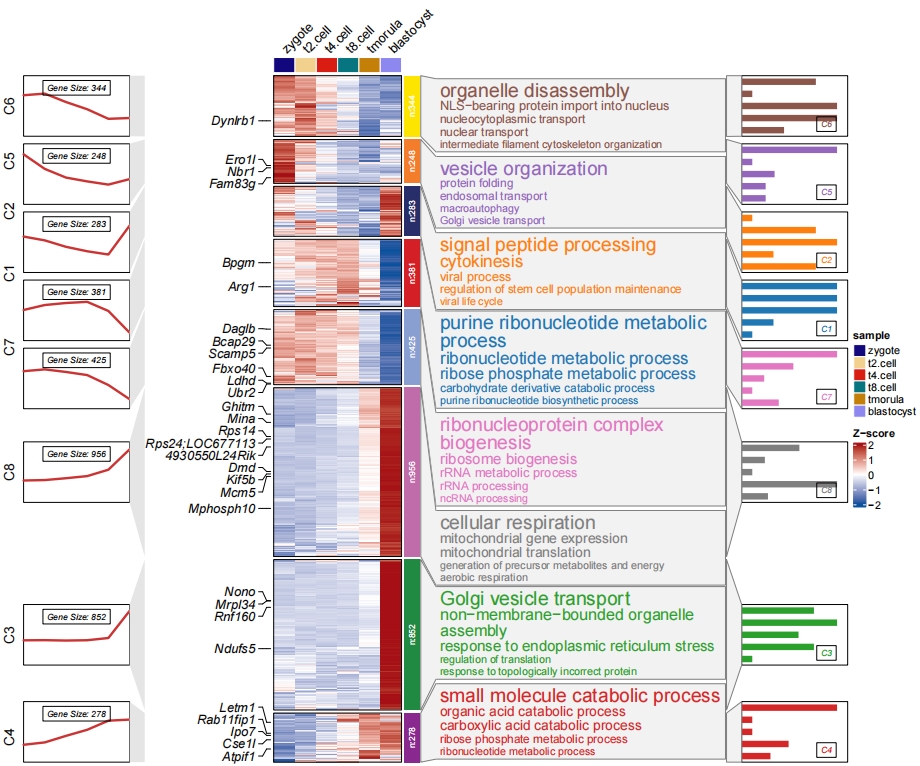
3.3 Batch enrichment analysis
enrichCluster can do batch enrichment analysis for each cluster using clusterpfofiler package. It will extract top 5 pathway terms(ordered by pvalue).
library(org.Mm.eg.db)
# enrich for clusters
enrich <- enrichCluster(object = ck,
OrgDb = org.Mm.eg.db,
type = "BP",
pvalueCutoff = 0.05,
topn = 5)
# check
head(enrich,3)
# group Description pvalue ratio
# GO:0009150 C1 purine ribonucleotide metabolic process 4.287676e-08 12
# GO:0009259...2 C1 ribonucleotide metabolic process 6.782860e-08 12
# GO:0019693...3 C1 ribose phosphate metabolic process 9.382227e-08 12
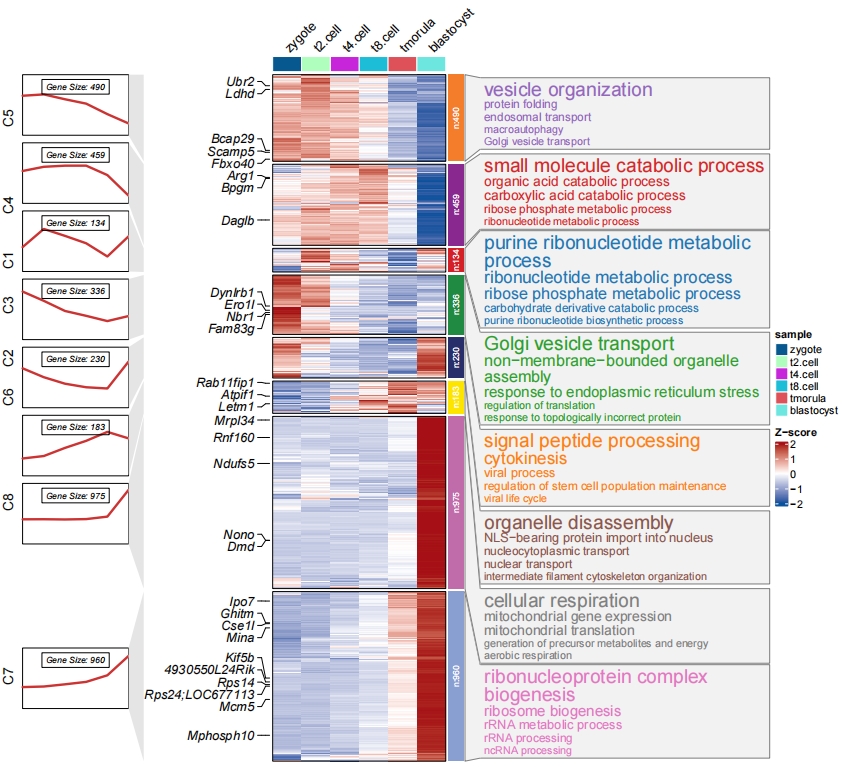
# plot
pdf('termenrich.pdf',height = 10,width = 11,onefile = F)
visCluster(object = ck,
plotType = "both",
column_names_rot = 45,
show_row_dend = F,
markGenes = markGenes,
markGenesSide = "left",
genesGp = c('italic',fontsize = 12,col = "black"),
annoTermData = enrich,
lineSide = "left",
goCol = rep(ggsci::pal_d3()(8),each = 5),
goSize = "pval")
dev.off()
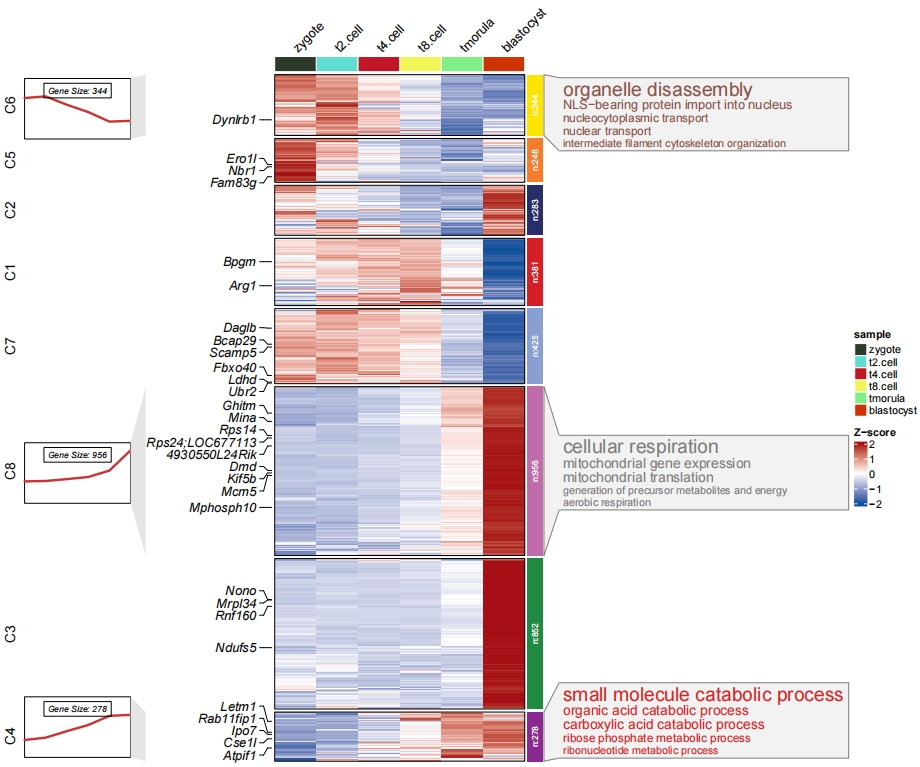
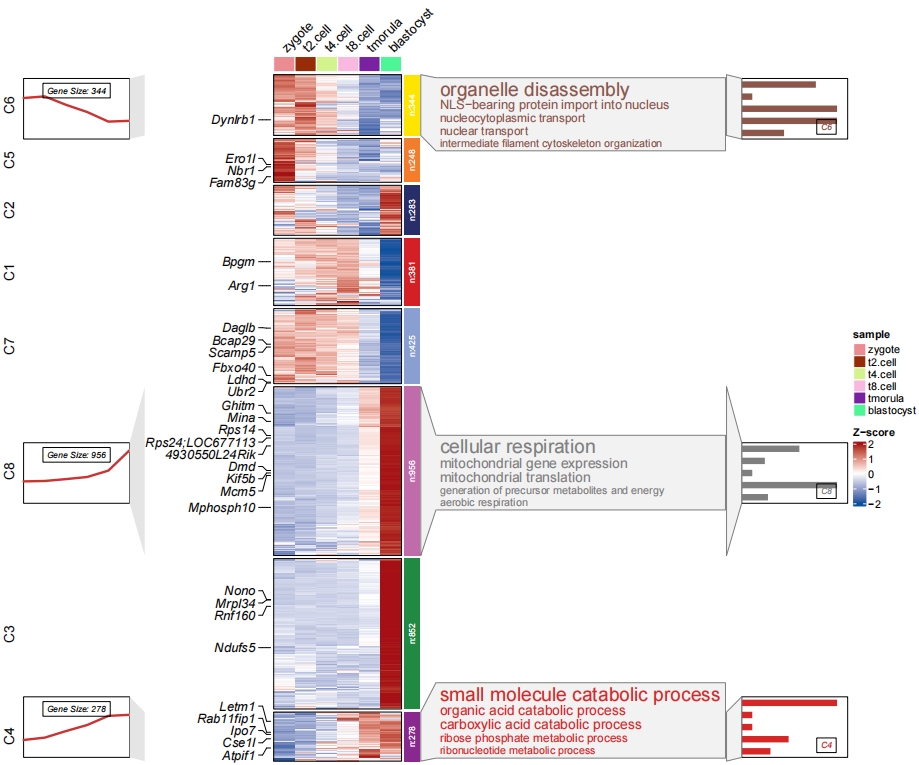
3.4 Add annotation for specific groups
You can define subgroup.anno to highlight specific groups you want.
# annotation for specific clusters
pdf('subc.pdf',height = 10,width = 12,onefile = F)
visCluster(object = cm,
           plotType = "both",
           column_names_rot = 45,
           show_row_dend = F,
           markGenes = markGenes,
           markGenesSide = "left",
           genesGp = c('italic',fontsize = 12,col = "black"),
           annoTermData = enrich,
           lineSide = "left",
           goCol = rep(ggsci::pal_d3()(8),each = 5),
           goSize = "pval",
           subgroupAnno = c("C4","C6","C8"))
dev.off()
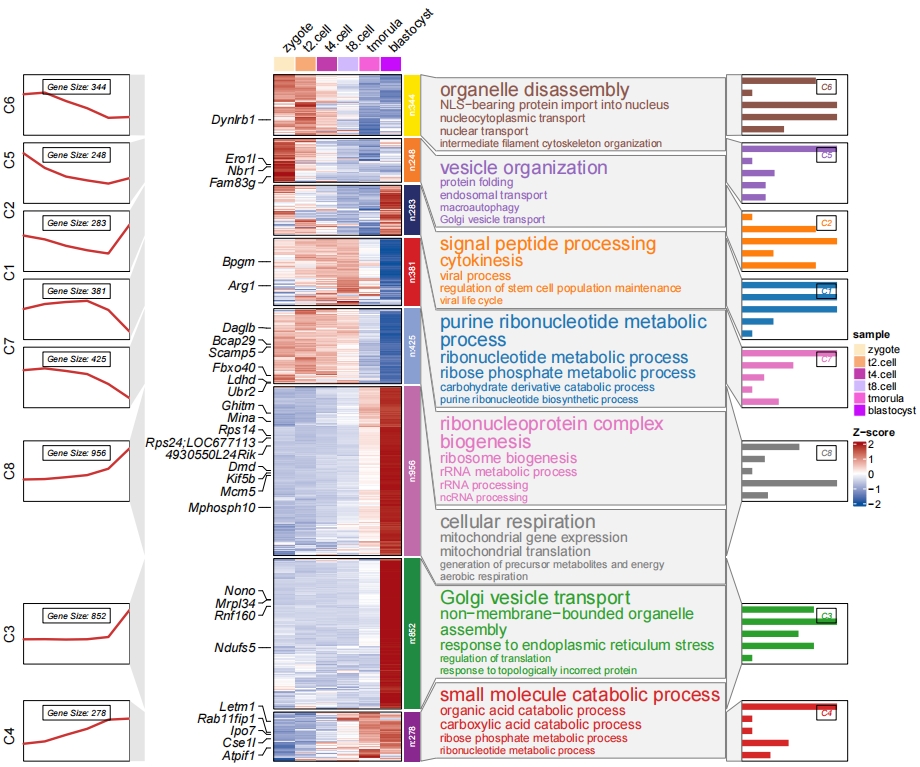
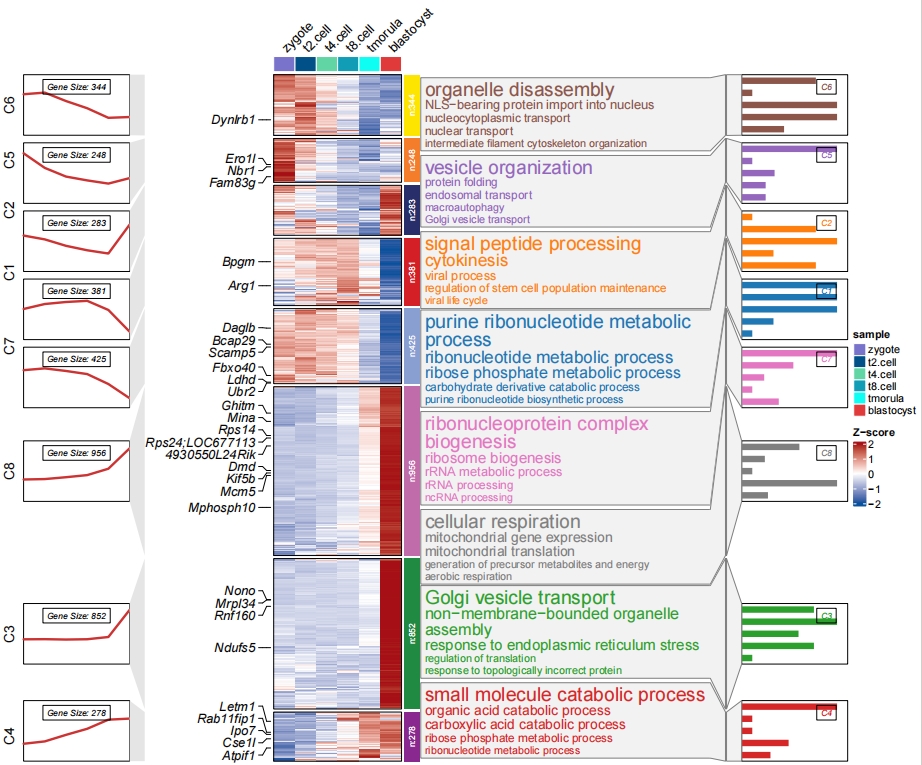
3.5 Add barplot for enrichment annotation
The barplot height will use the enrichment data frame last column to plot:
pdf('bar.pdf',height = 10,width = 12,onefile = F)
visCluster(object = cm,
           plotType = "both",
           column_names_rot = 45,
           show_row_dend = F,
           markGenes = markGenes,
           markGenesSide = "left",
           genesGp = c('italic',fontsize = 12,col = "black"),
           annoTermData = enrich,
           lineSide = "left",
           goCol = rep(ggsci::pal_d3()(8),each = 5),
           goSize = "pval",
           addBar = T)
dev.off()
Match the enrichment annotation right side and barplot annotation left side:
# change side
pdf('barc.pdf',height = 10,width = 12,onefile = F)
visCluster(object = cm,
           plotType = "both",
           column_names_rot = 45,
           show_row_dend = F,
           markGenes = markGenes,
           markGenesSide = "left",
           genesGp = c('italic',fontsize = 12,col = "black"),
           annoTermData = enrich,
           lineSide = "left",
           goCol = rep(ggsci::pal_d3()(8),each = 5),
           addBar = T,
           goSize = "pval",
           annoTermMside = "left")
dev.off()
Adjust cluster label position in barplot:
# change barplot cluster label position
pdf('barp.pdf',height = 10,width = 12,onefile = F)
visCluster(object = cm,
           plotType = "both",
           column_names_rot = 45,
           show_row_dend = F,
           markGenes = markGenes,
           markGenesSide = "left",
           genesGp = c('italic',fontsize = 12,col = "black"),
           annoTermData = enrich,
           lineSide = "left",
           goCol = rep(ggsci::pal_d3()(8),each = 5),
           goSize = "pval",
           addBar = T,
           textbarPos = c(0.8,0.2))
dev.off()
Add annotation for specific cluster:
# sub-clusters with barplot
pdf('subcb.pdf',height = 10,width = 12,onefile = F)
visCluster(object = cm,
           plotType = "both",
           column_names_rot = 45,
           show_row_dend = F,
           markGenes = markGenes,
           markGenesSide = "left",
           genesGp = c('italic',fontsize = 12,col = "black"),
           annoTermData = enrich,
           lineSide = "left",
           goCol = rep(ggsci::pal_d3()(8),each = 5),
           goSize = "pval",
           addBar = T,
           textbarPos = c(0.8,0.2),
           subgroupAnno = c("C4","C6","C8"))
dev.off()
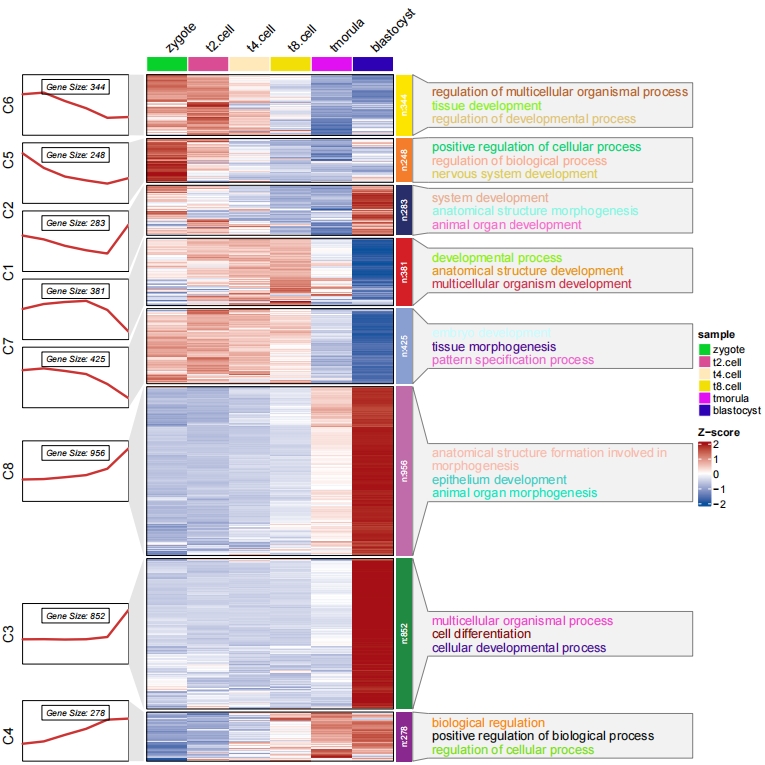
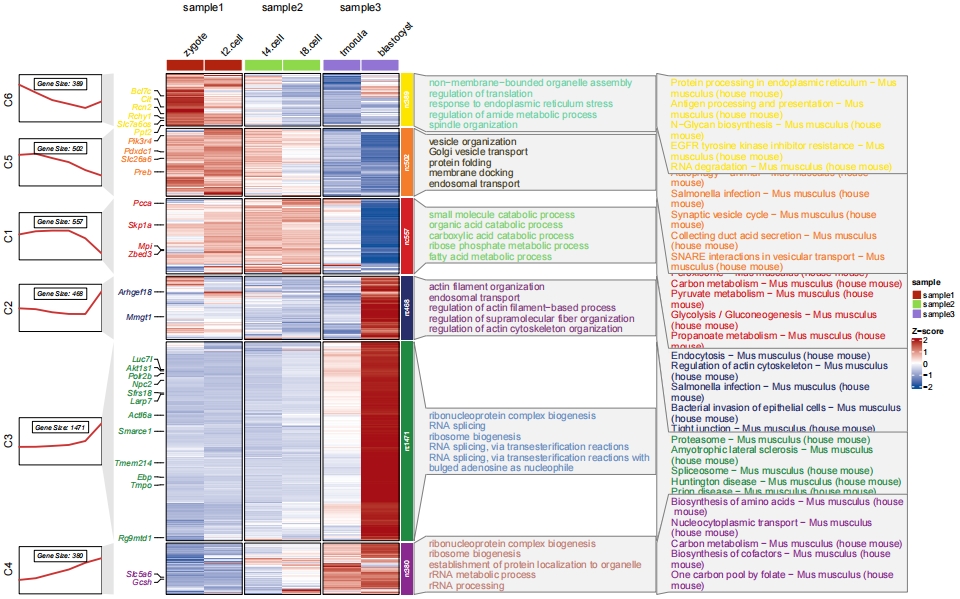
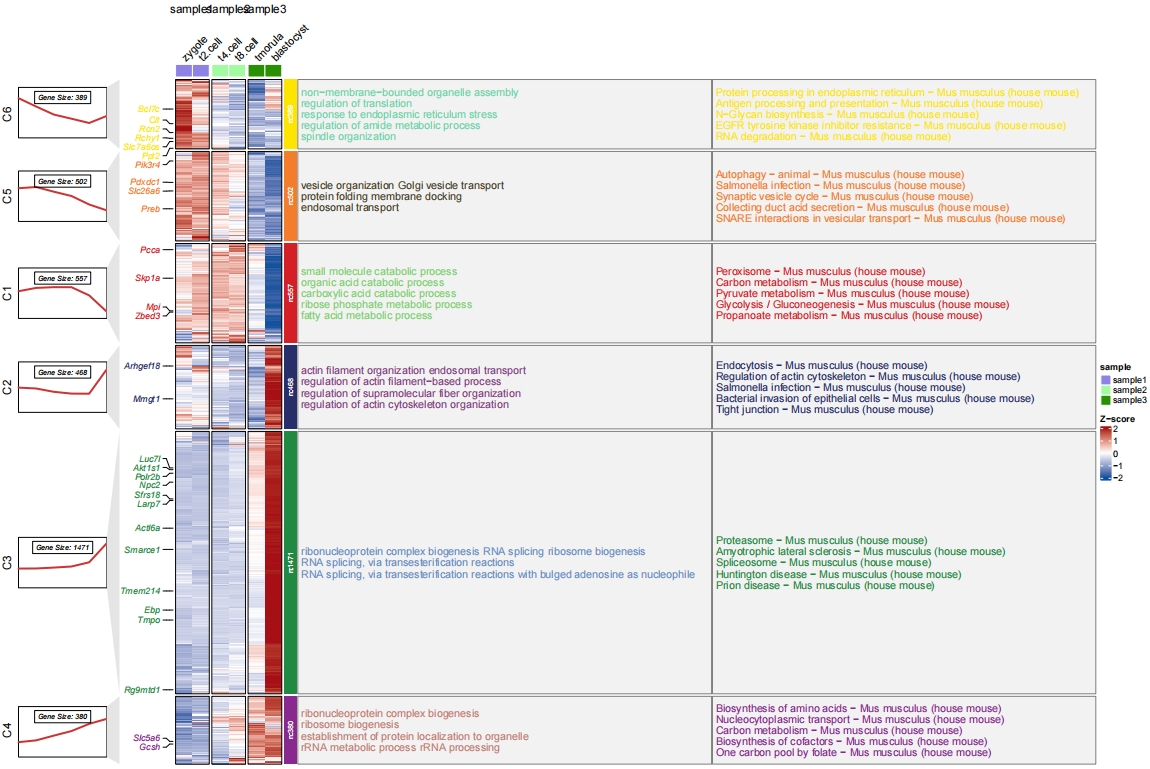
3.6 Add KEGG annotation
Sometimes you may want to perform both GO and KEGG enrichment results, here is an example:
# using mfuzz for clustering
# mfuzz
cm <- clusterData(obj = exps,
                  clusterMethod = "mfuzz",
                  clusterNum = 6)

# GO enrich for clusters
enrich.go <- enrichCluster(object = cm,
                           OrgDb = org.Mm.eg.db,
                           type = "BP",
                           pvalueCutoff = 0.05,
                           topn = 5)

# check
head(enrich.go,3)

#            group                       Description       pvalue     ratio
# GO:0044282    C1  small molecule catabolic process 3.376035e-32 10.683761
# GO:0046395    C1 carboxylic acid catabolic process 8.123713e-20  6.623932
# GO:0016054    C1    organic acid catabolic process 1.057149e-19  6.623932

# KEGG enrich for clusters
enrich.kegg <- enrichCluster(object = cm,
                             OrgDb = org.Mm.eg.db,
                             type = "KEGG",
                             organism = "mmu",
                             pvalueCutoff = 0.05,
                             topn = 5)

# check
head(enrich.kegg,3)

#              group                                      Description       pvalue    ratio
# mmu04146        C1          Peroxisome - Mus musculus (house mouse) 1.087835e-16 8.880309
# mmu01200...2    C1   Carbon metabolism - Mus musculus (house mouse) 3.447857e-14 9.266409
# mmu00620        C1 Pyruvate metabolism - Mus musculus (house mouse) 1.466749e-10 5.019305

# add gene name
markGenes = rownames(exps)[sample(1:nrow(exps),30,replace = F)]

# plot
pdf('gokegg.pdf',height = 10,width = 16,onefile = F)
visCluster(object = cm,
           plotType = "both",
           column_names_rot = 45,
           show_row_dend = F,
           markGenes = markGenes,
           markGenesSide = "left",
           annoTermData = enrich.go,
           goCol = rep(jjAnno::useMyCol("calm",n = 6),each = 5),
           annoKeggData = enrich.kegg,
           keggCol = rep(jjAnno::useMyCol("stallion",n = 6),each = 5),
           lineSide = "left",
           sampleGroup = rep(c("sample1","sample2","sample3"),each = 2))
dev.off()
Format the annotation panel:
# change textbox style
pdf('gokeggsq.pdf',height = 12,width = 18,onefile = F)
visCluster(object = cm,
           plotType = "both",
           column_names_rot = 45,
           show_row_dend = F,
           markGenes = markGenes,
           markGenesSide = "left",
           annoTermData = enrich.go,
           goCol = rep(jjAnno::useMyCol("calm",n = 6),each = 5),
           byGo = "anno_block",
           annoKeggData = enrich.kegg,
           keggCol = rep(jjAnno::useMyCol("stallion",n = 6),each = 5),
           byKegg = "anno_block",
           wordWrap = F,addNewLine = F,
           lineSide = "left",
           sampleGroup = rep(c("sample1","sample2","sample3"),each = 2))
dev.off()
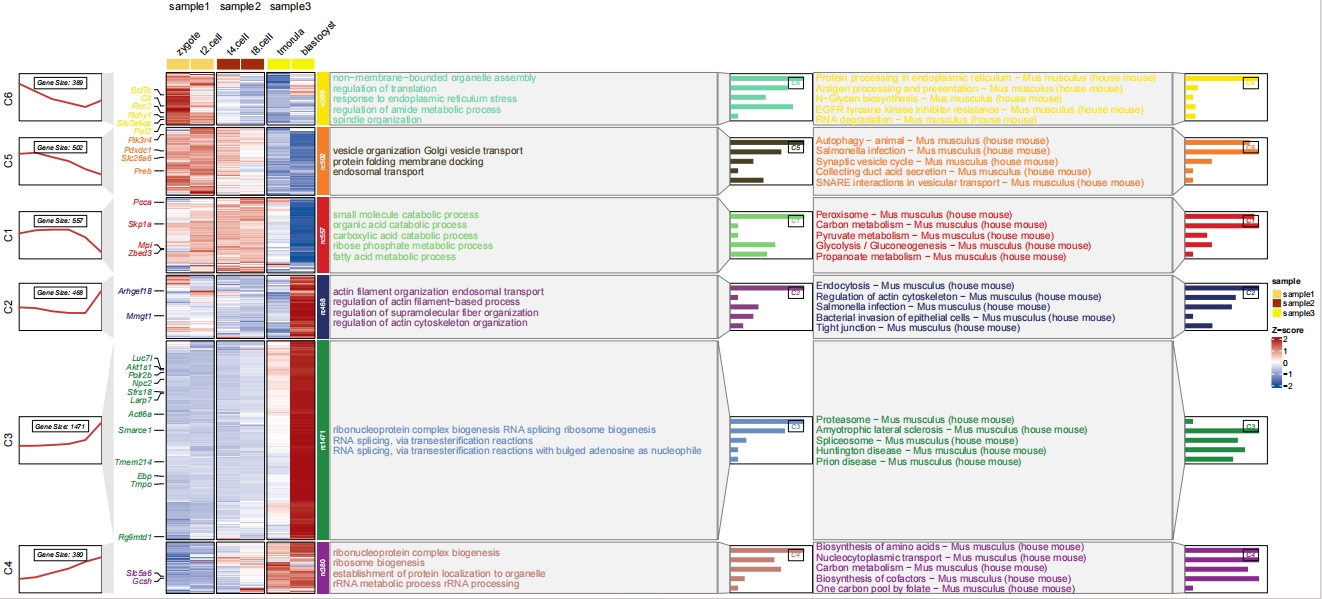
Add both barplot for GO and KEGG:
# change style
pdf('gokeggbarNew.pdf',height = 10,width = 20,onefile = F)
visCluster(object = cm,
           plotType = "both",
           column_names_rot = 45,
           show_row_dend = F,
           markGenes = markGenes,
           markGenesSide = "left",
           annoTermData = enrich.go,
           goCol = rep(jjAnno::useMyCol("calm",n = 6),each = 5),
           addBar = T,
           byGo = "anno_block",
           annoKeggData = enrich.kegg,
           keggCol = rep(jjAnno::useMyCol("stallion",n = 6),each = 5),
           addKeggBar = T,
           byKegg = "anno_block",
           wordWrap = F,addNewLine = F,
           lineSide = "left",
           sampleGroup = rep(c("sample1","sample2","sample3"),each = 2))
dev.off()
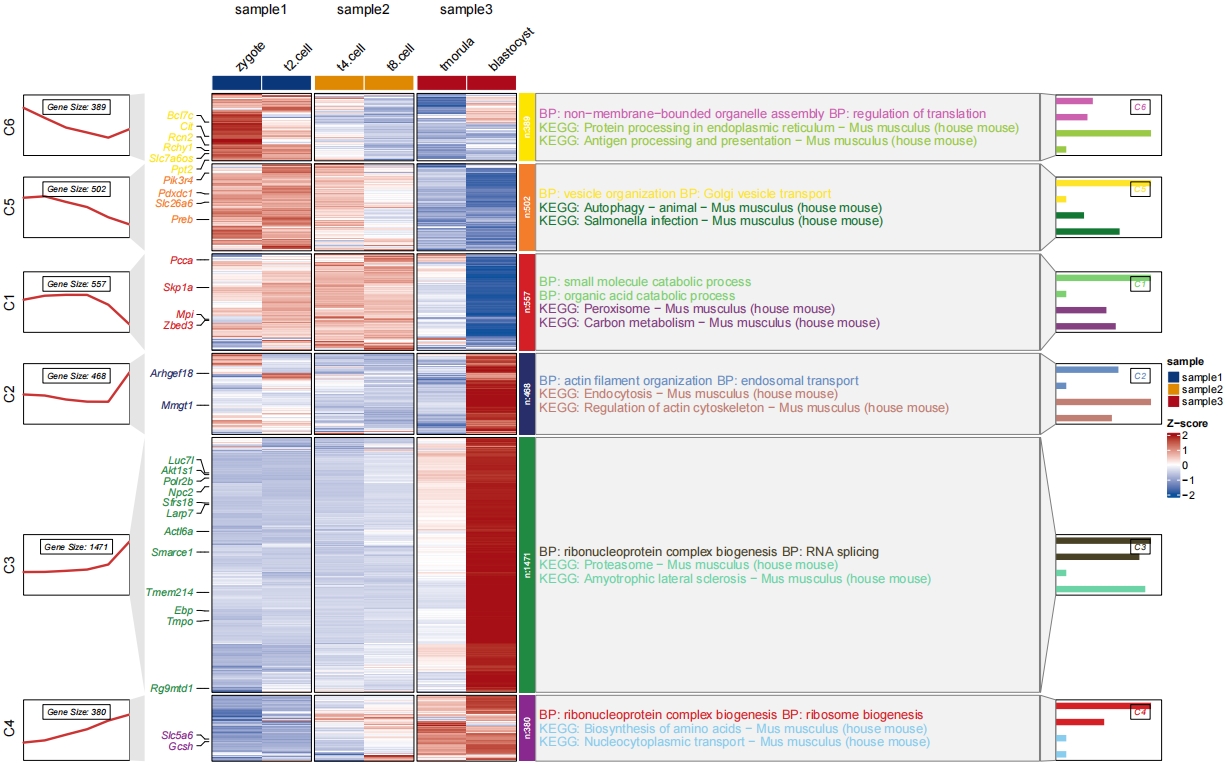
The another solution is to combine the GO and KEGG resluts and plot in a single panel with different colors to distinguish them:
# combine go and kegg data
library(dplyr)

all <- rbind(enrich.go %>% group_by(group) %>% slice_head(n = 2) %>%
               mutate(Description = paste("BP: ",Description,sep = "")),
             enrich.kegg %>% group_by(group) %>% slice_head(n = 2) %>%
               mutate(Description = paste("KEGG: ",Description,sep = ""))) %>%
  arrange(group)

# plot
pdf('gokeggcomb.pdf',height = 10,width = 16,onefile = F)
visCluster(object = cm,
           plotType = "both",
           column_names_rot = 45,
           show_row_dend = F,
           markGenes = markGenes,
           markGenesSide = "left",
           annoTermData = all,
           goCol = c(rep(jjAnno::useMyCol("calm",n = 6),each = 2),
                      rep(jjAnno::useMyCol("circus",n = 6),each = 2)),
           lineSide = "left",
           wordWrap = F,addNewLine = F,
           byGo = "anno_block",
           addBar = T,
           sampleGroup = rep(c("sample1","sample2","sample3"),each = 2))
dev.off()