Chapter 8 annoLegend
This function can be used to add some legend annotations beside the plot or in plot.
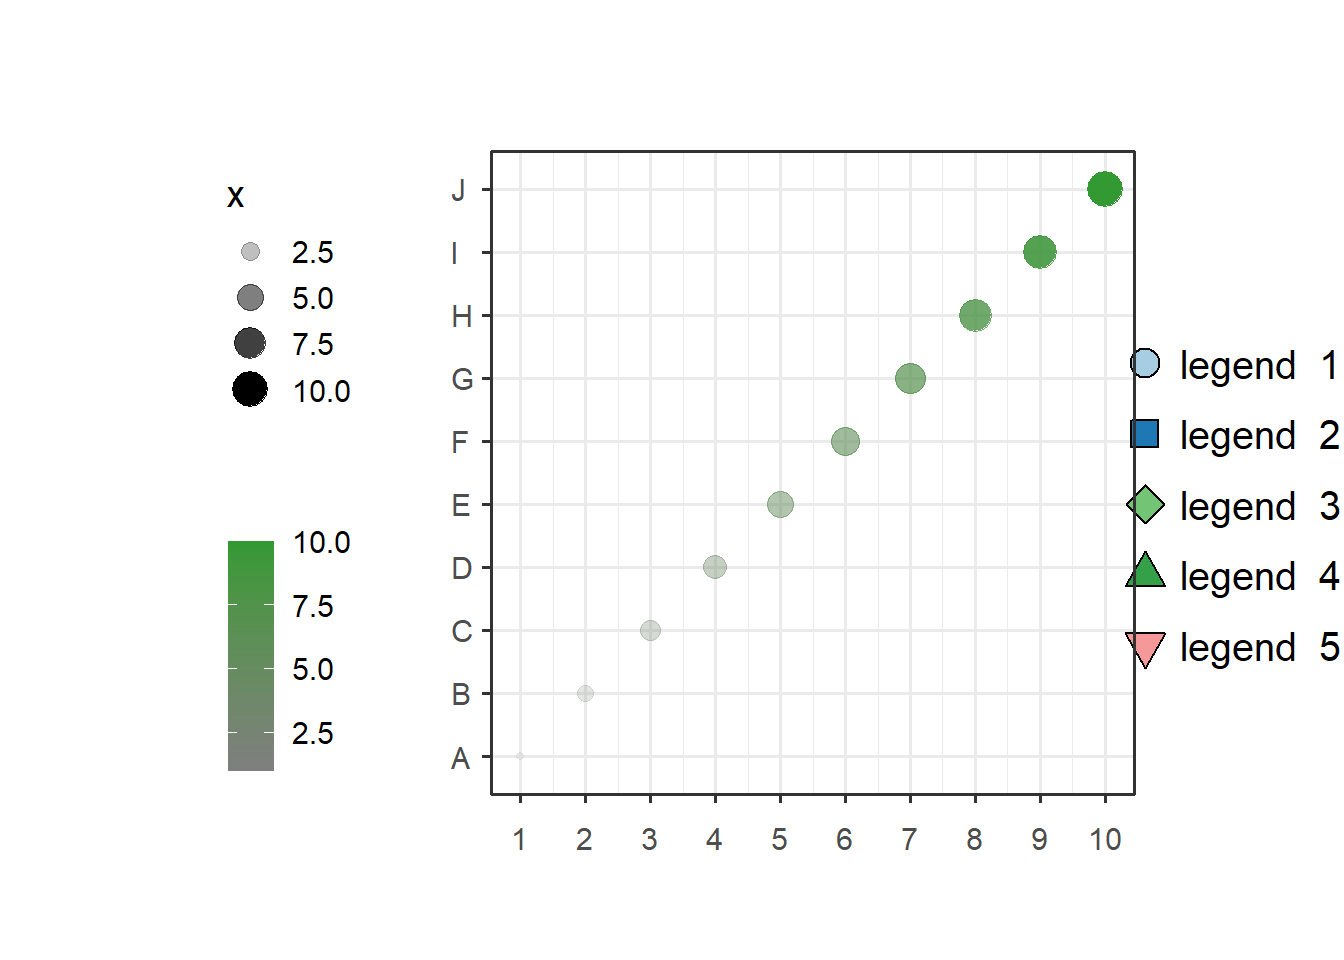
Simple annotation:
library(jjAnno)

# add legend
annoLegend(object = p,
           labels = paste('legend ',1:5),
           pch = 21,
           col = 'black',
           fill = useMyCol('paired',5),
           textSize = 15)
## [1] "This palatte have 12 colors!"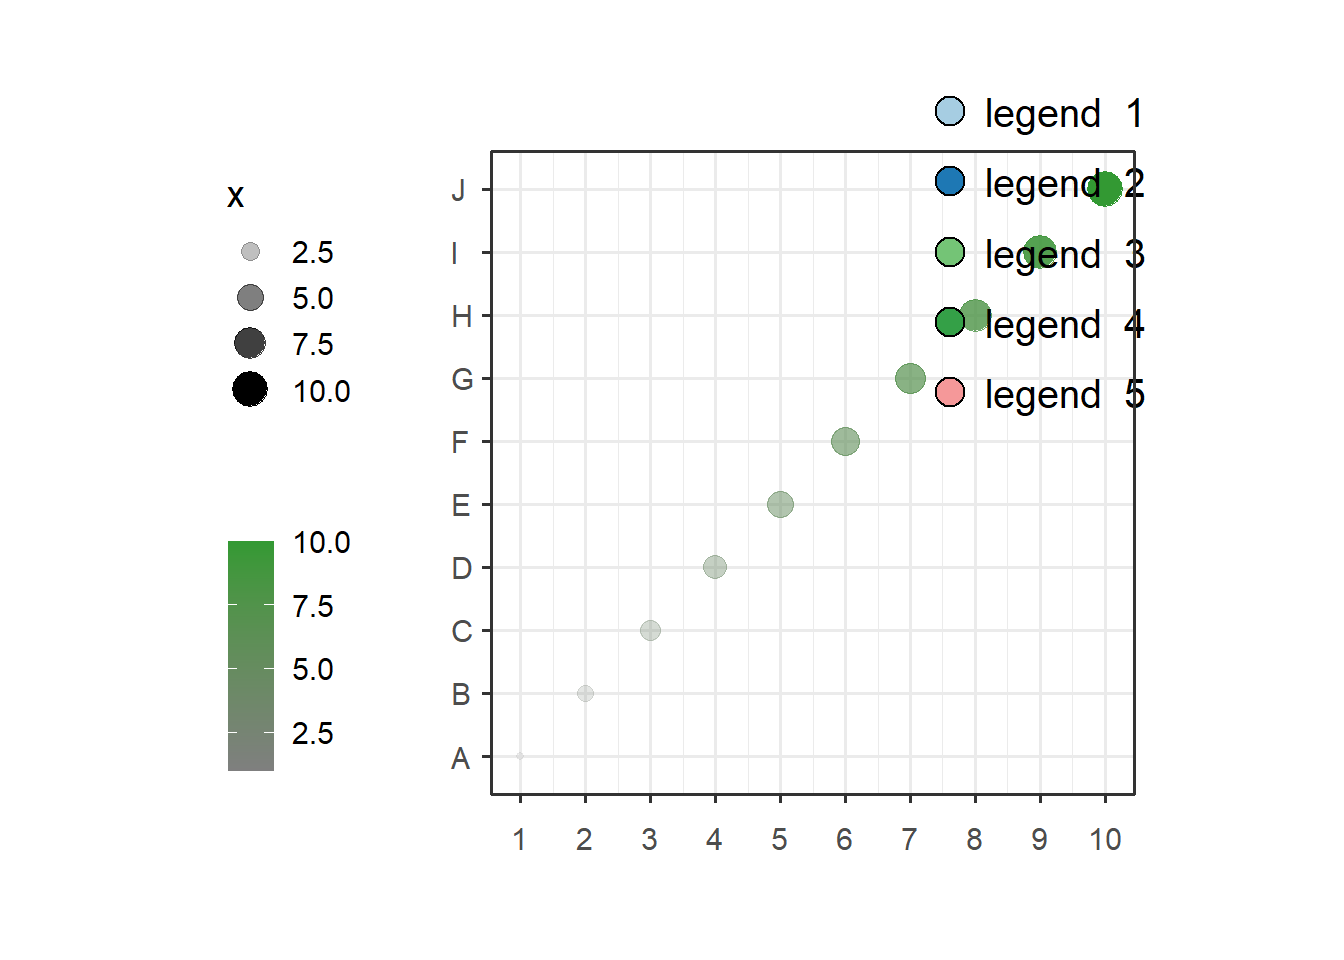
Change legend position:
# change pos
annoLegend(object = p,
           relPos = c(0.2,0.9),
           labels = paste('legend ',1:5),
           pch = 21,
           col = 'black',
           fill = useMyCol('paired',5),
           textSize = 15)
## [1] "This palatte have 12 colors!"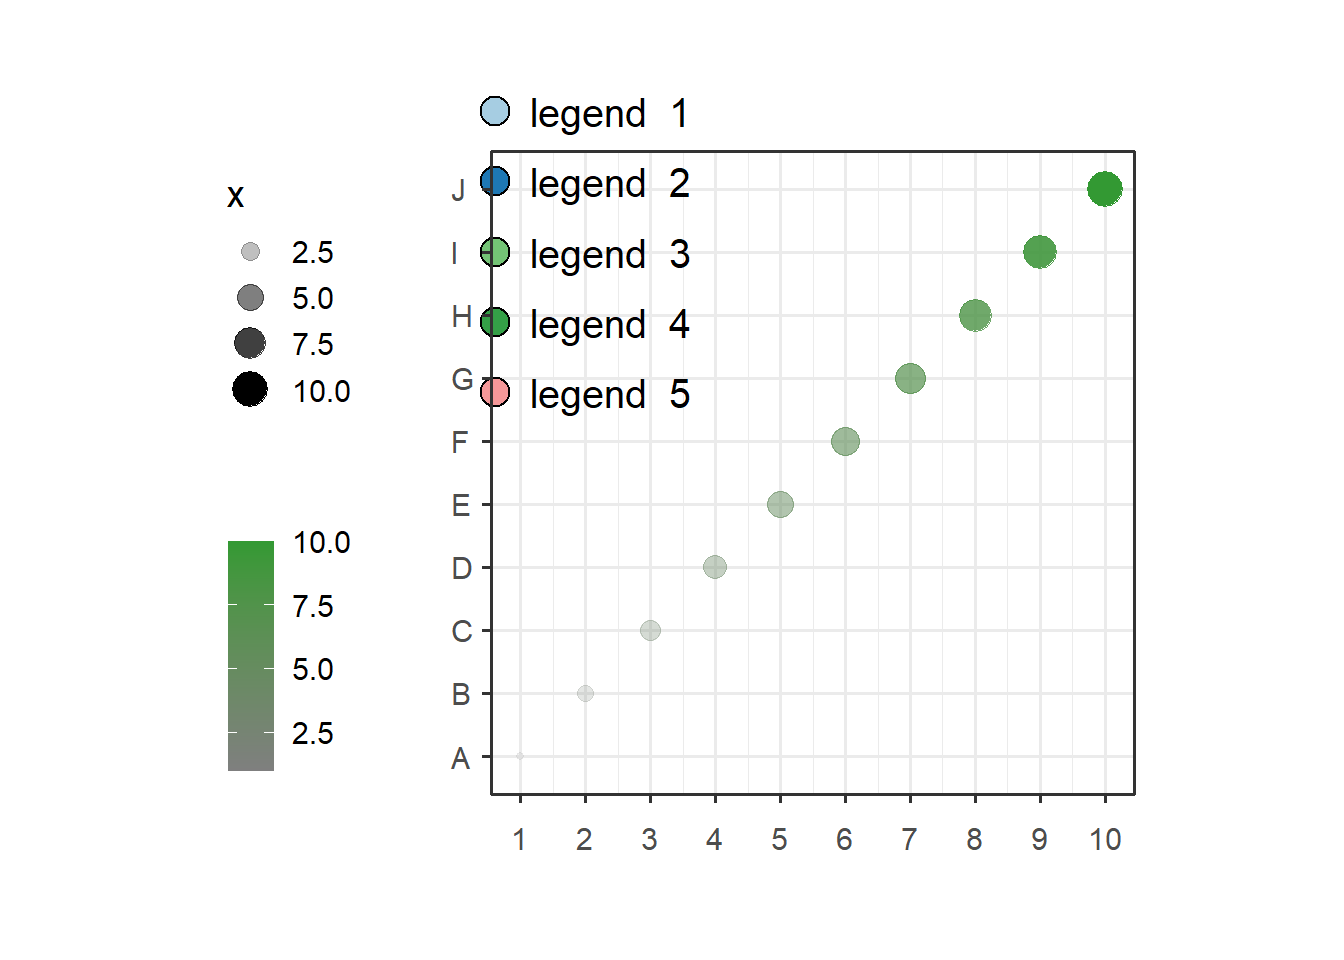
Add multiple shapes:
# multiple shapes
annoLegend(object = p,
           relPos = c(0.2,0.9),
           labels = paste('legend ',1:5),
           pch = 21:25,
           col = 'black',
           fill = useMyCol('paired',5),
           textSize = 15)
## [1] "This palatte have 12 colors!"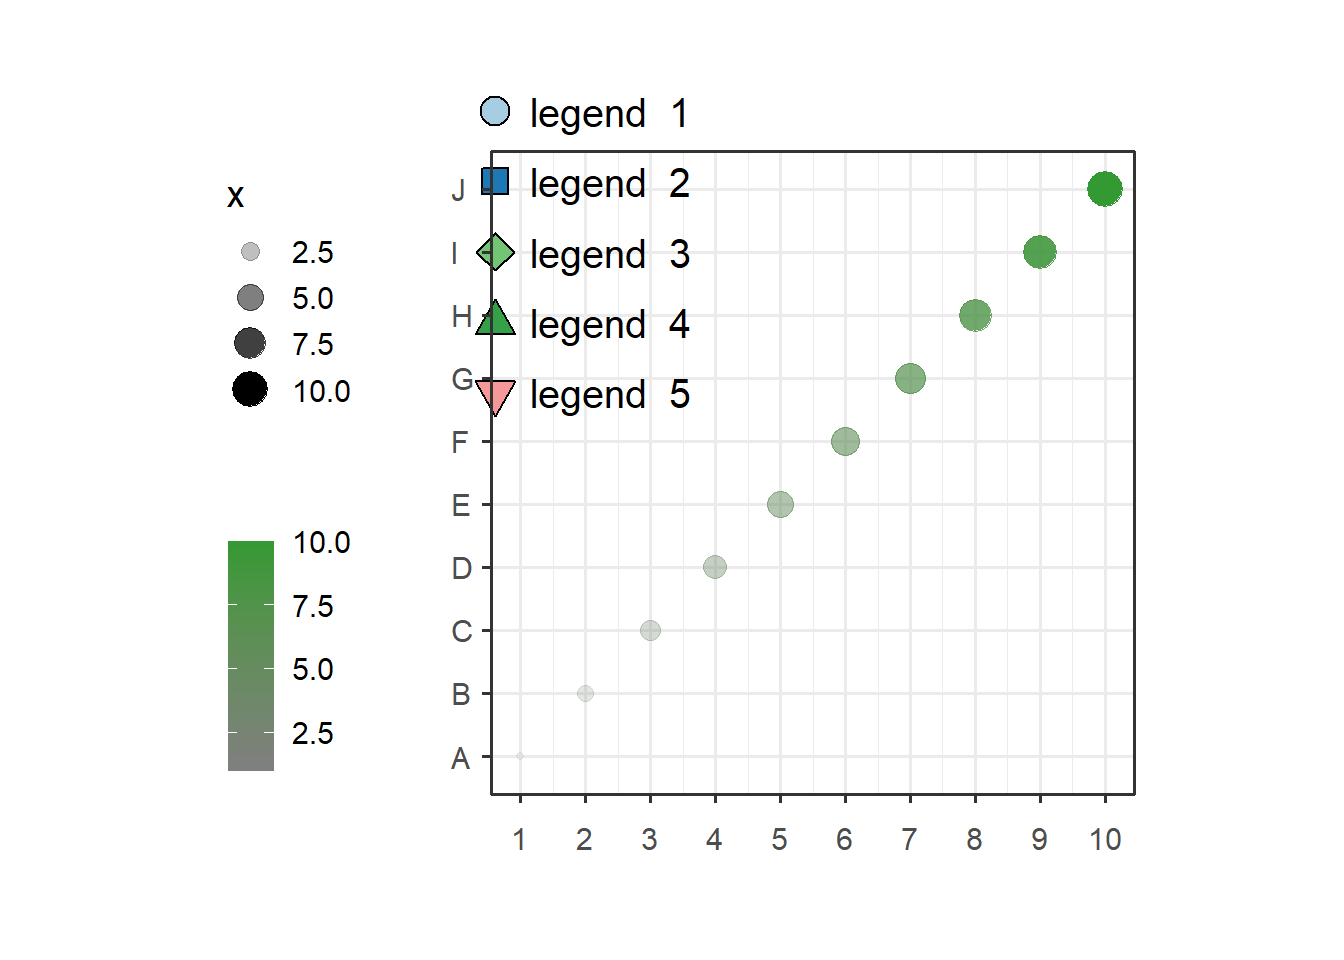
Define x and y position:
# define x and y position
annoLegend(object = p,
           xPosition = 12,
           yPosition = 5,
           labels = paste('legend ',1:5),
           pch = 21:25,
           col = 'black',
           fill = useMyCol('paired',5),
           textSize = 15)
## [1] "This palatte have 12 colors!"