Chapter 11 gradient color rect introduction
Here I use the rasterGrob function instead of rectGrob in grid package to acheive a rect annotation with a gradient filled colors which can make your rect annotation much pretty.
relavent parameters:
- trun on continuesRect == TRUE.
11.1 Examples
Let’s see an exampe with normal rect annotation:
library(jjAnno)

# load test data
data(pdot)

# normal example
annoRect(object = pdot,
         annoPos = 'botomn',
         aesGroup = T,
         aesGroName = 'class',
         yPosition = c(-2,0.4),
         rectWidth = 0.8)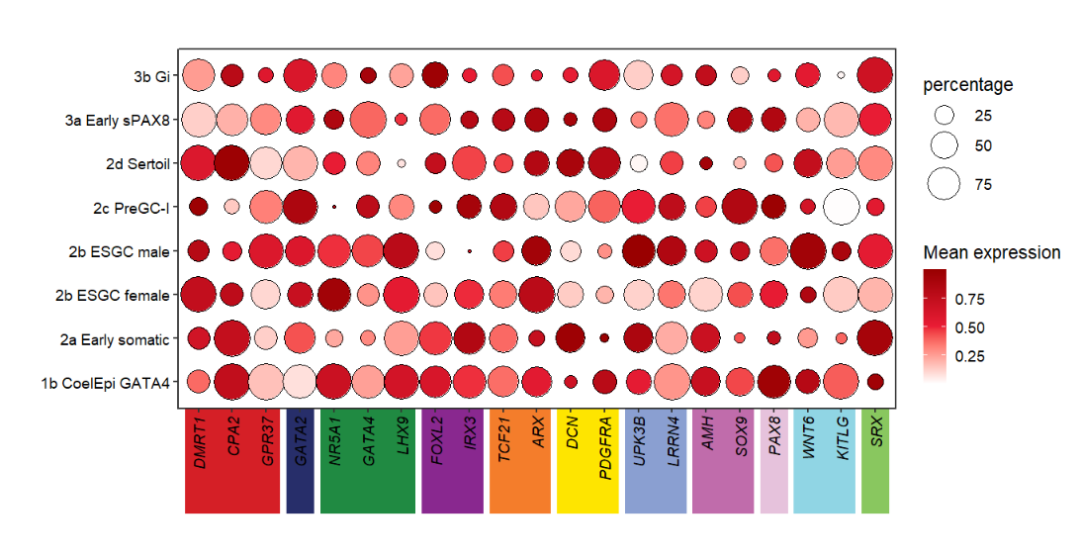
Add a gradient filled color rect annotation:
# add continues color rect
annoRect(object = pdot,
         annoPos = 'botomn',
         aesGroup = T,
         aesGroName = 'class',
         yPosition = c(-2,0.4),
         rectWidth = 0.8,
         continuesRect = T)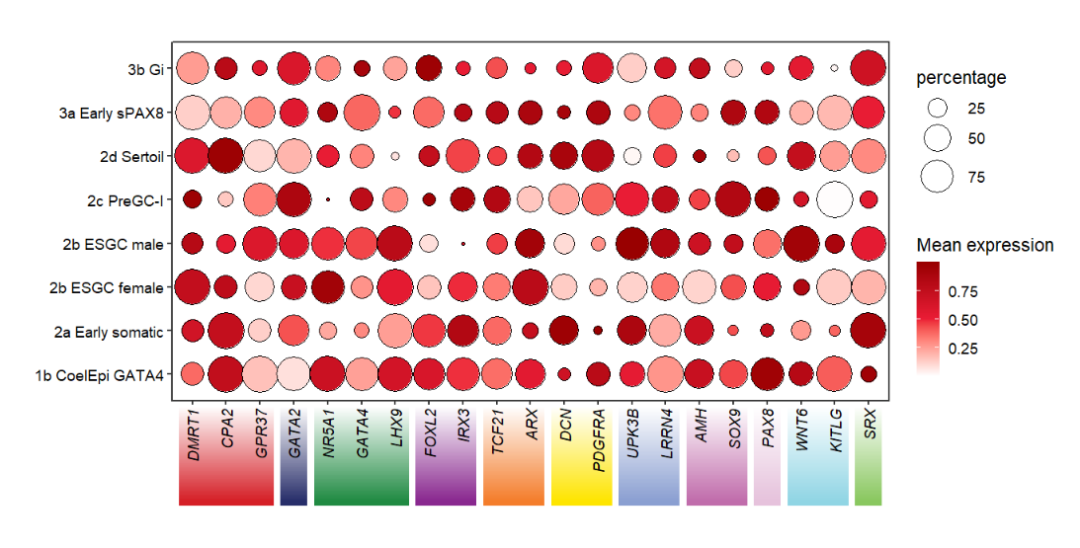
Add border to rect:
# add border to rect
annoRect(object = pdot,
         annoPos = 'botomn',
         aesGroup = T,
         aesGroName = 'class',
         yPosition = c(-2,0.4),
         rectWidth = 0.8,
         continuesRect = T,
         border = T)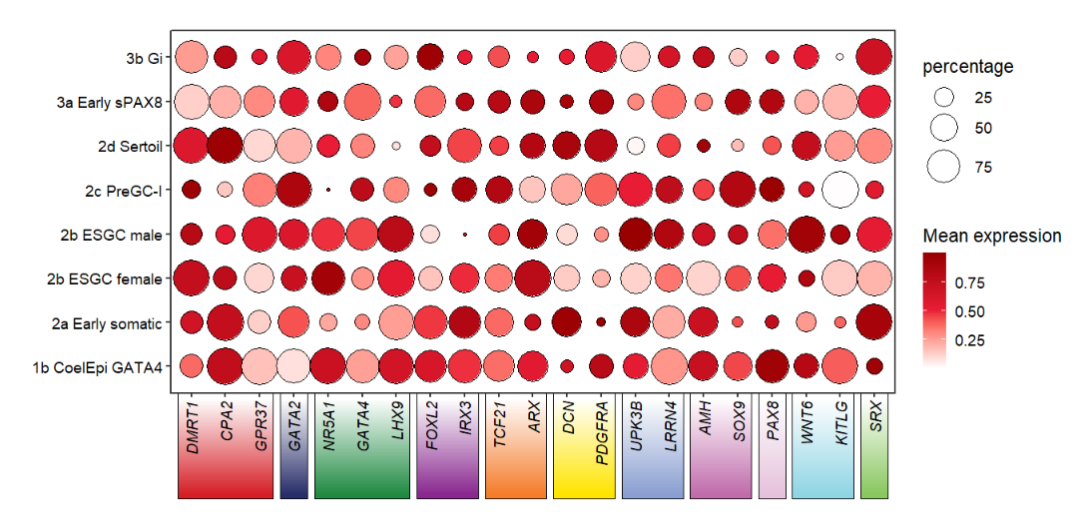
Reverse the gradient color:
# reverse color vertically
annoRect(object = pdot,
         annoPos = 'botomn',
         aesGroup = T,
         aesGroName = 'class',
         yPosition = c(-2,0.4),
         rectWidth = 0.8,
         continuesRect = T,
         border = T,
         revColV = T)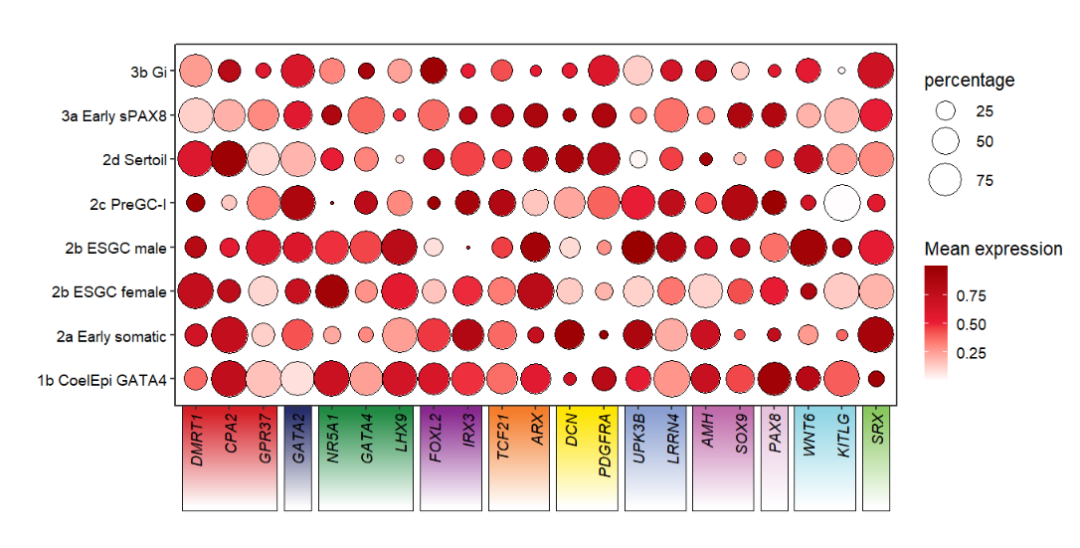
Add to left:
# add to left
annoRect(object = pdot,
         annoPos = 'left',
         aesGroup = T,
         aesGroName = 'cellGroup',
         xPosition = c(-4,0.4),
         rectWidth = 0.8,
         continuesRect = T)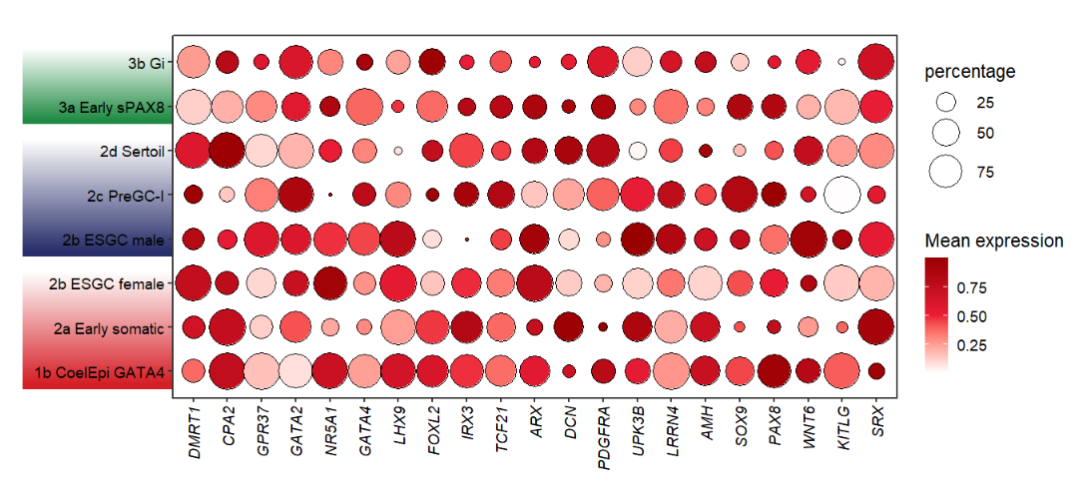
You can use revColH to control the colors to be arranged horizontally:
# reverse color horizontally
annoRect(object = pdot,
         annoPos = 'left',
         aesGroup = T,
         aesGroName = 'cellGroup',
         xPosition = c(-4,0.4),
         rectWidth = 0.8,
         continuesRect = T,
         revColH = T,
         revColV = T,
         border = T)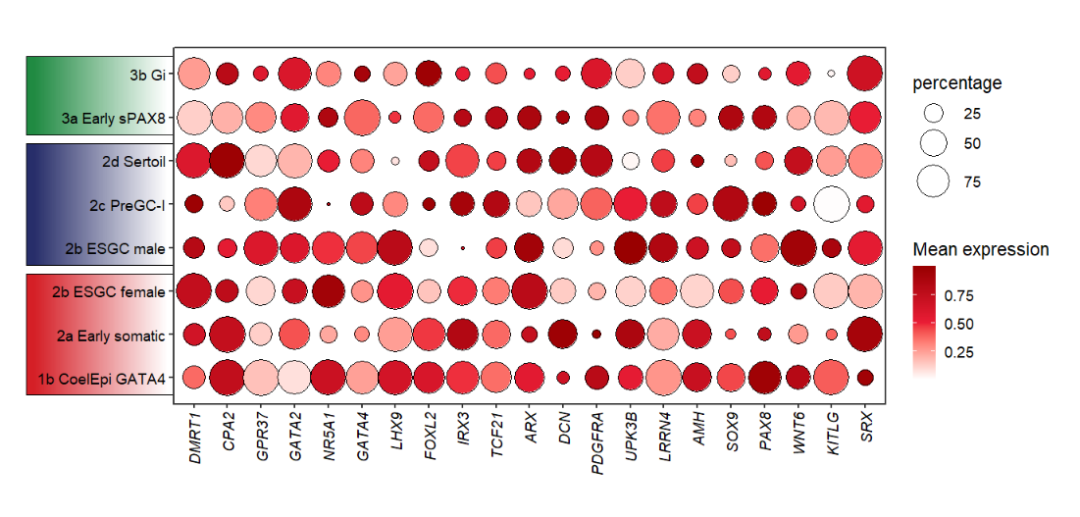
You can also supply your own colors to fill in rect with a list:
library(RColorBrewer)
# add own color
annoRect(object = pdot,
         annoPos = 'left',
         aesGroup = T,
         aesGroName = 'cellGroup',
         xPosition = c(-4,0.4),
         rectWidth = 0.8,
         continuesRect = T,
         revColH = T,
         revColV = T,
         conRectCol = list(brewer.pal(11,'BrBG')[3:9],
                           brewer.pal(11,'PRGn')[3:9],
                           brewer.pal(11,'PiYG')[3:9]))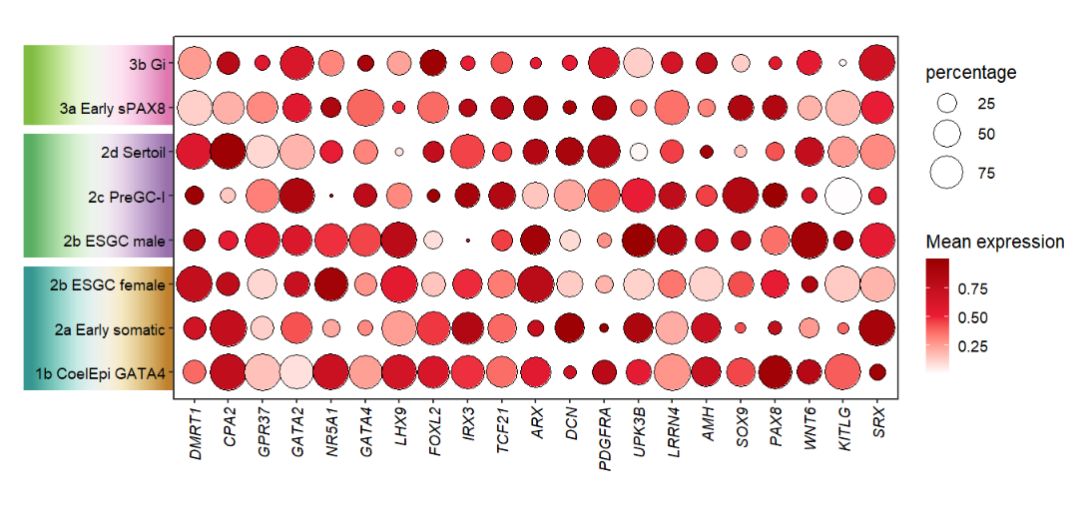
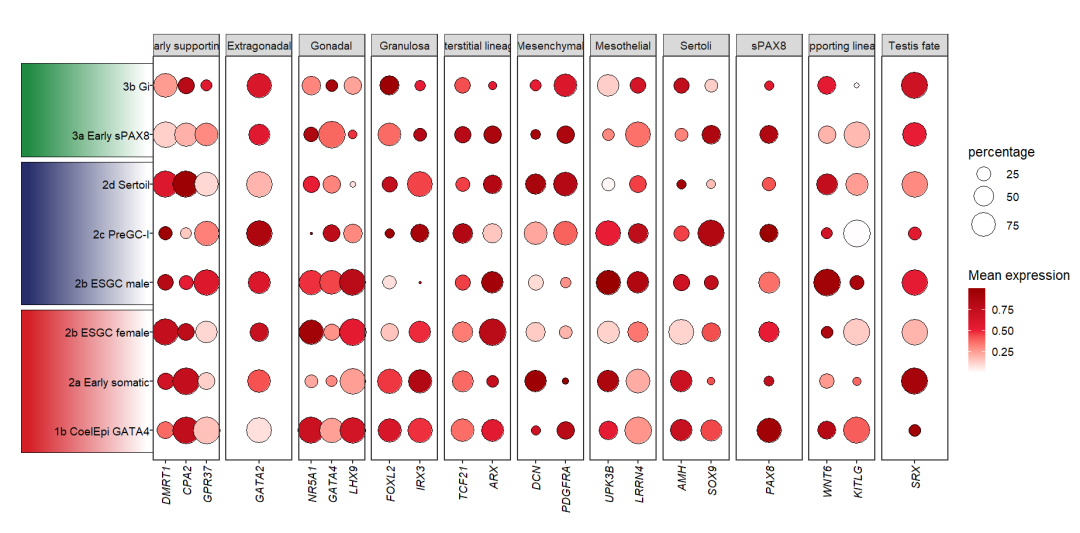
Gradient color rect also can be applied on facet plot:
# facet plot
data("pdotfc")

pfacet1 <-
  pdotfc +
  facet_wrap(~class,
             nrow = 1,scales = 'free_x') +
  theme(axis.text.y = element_text(margin = margin(l = 1,unit = 'cm')))

# add to left
annoRect(object = pfacet1,
         annoPos = 'left',
         aesGroup = T,
         aes_x = 'gene',
         aes_y = 'cell',
         aesGroName = 'cellGroup',
         myFacetGrou = 'Early supporting',
         xPosition = c(-6,0.4),
         rectWidth = 0.9,
         continuesRect = T,
         revColH = T,
         revColV = T,
         border = T)