Chapter 4 annoPoint
This function can be used to add some points annotations beside the plot or in plot.
4.1 test data
Let’s make a test data:
library(jjAnno)
library(ggplot2)
## Warning: 程辑包'ggplot2'是用R版本4.1.3 来建造的df <- data.frame(x = 1:10,y = sample(1:10,10),
x1 = LETTERS[1:10])Make a simple plot:
library (ggplot2)

p <-
  ggplot(df, aes(x,x1)) +
  geom_point(aes(size = x,color = x,alpha = x)) +
  theme_bw(base_size = 14) +
  scale_x_continuous(breaks = seq(1,10,1)) +
  # scale_y_continuous(breaks = seq(1,10,1)) +
  scale_color_gradient(low = 'grey50',high = '#339933',name = '') +
  coord_cartesian(clip = 'off') +
  theme(aspect.ratio = 1,
        plot.margin = margin(t = 1,r = 1,b = 1,l = 1,unit = 'cm'),
        axis.text.x = element_text(vjust = unit(-1.5,'native')),
        legend.position = 'left') +
  xlab('') + ylab('')

p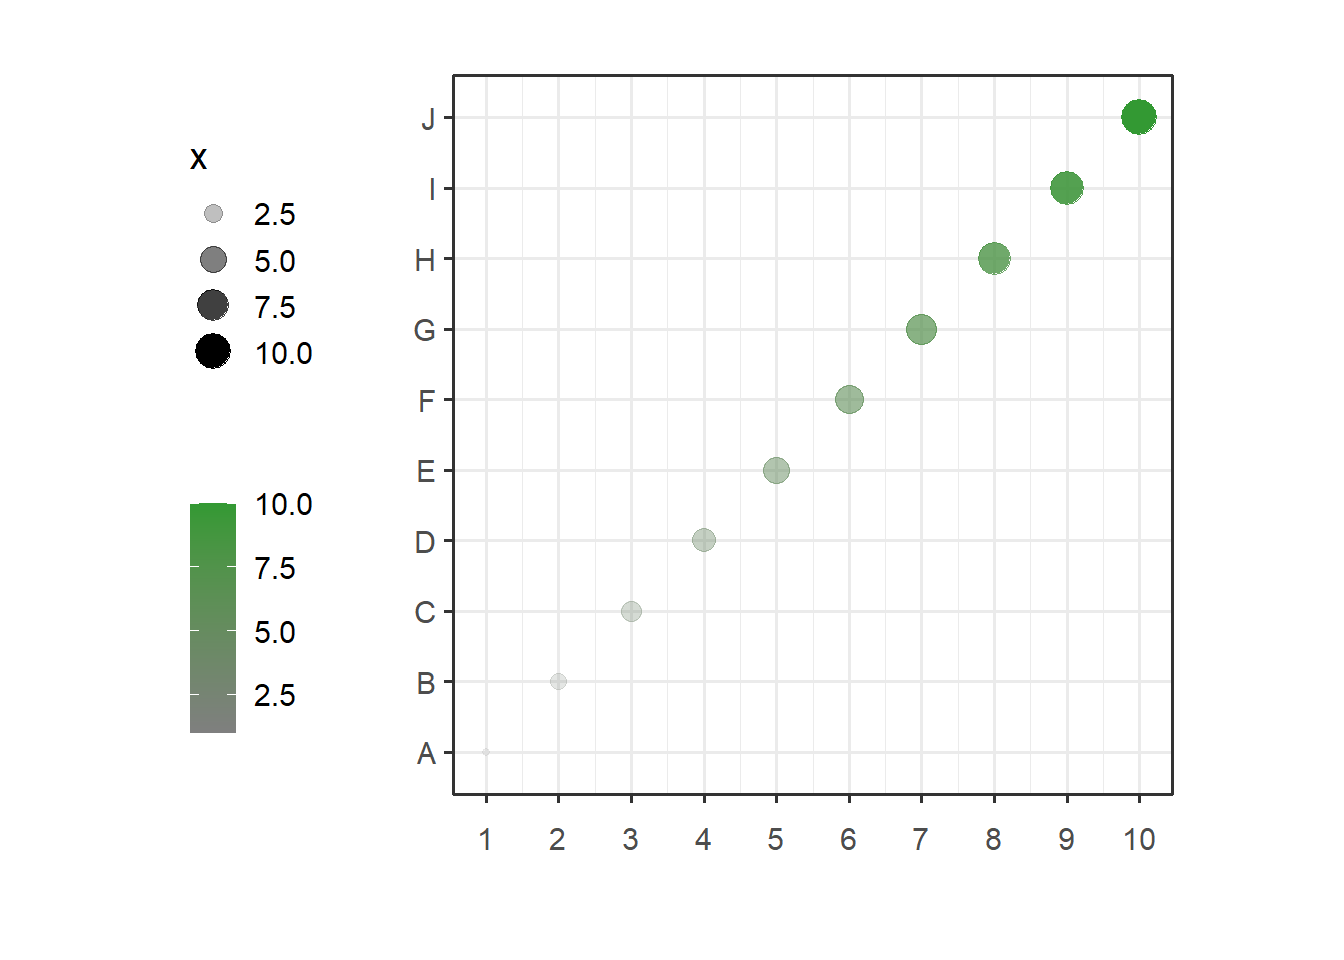
Or we can use test data in this package:
data(p)4.2 annotate plot
Now we can use annoPoint to add points in our plot.
Default is the top position:
# default plot
annoPoint(object = p,
          annoPos = 'top',
          xPosition = c(1:10))
## [1] "This palatte have 20 colors!"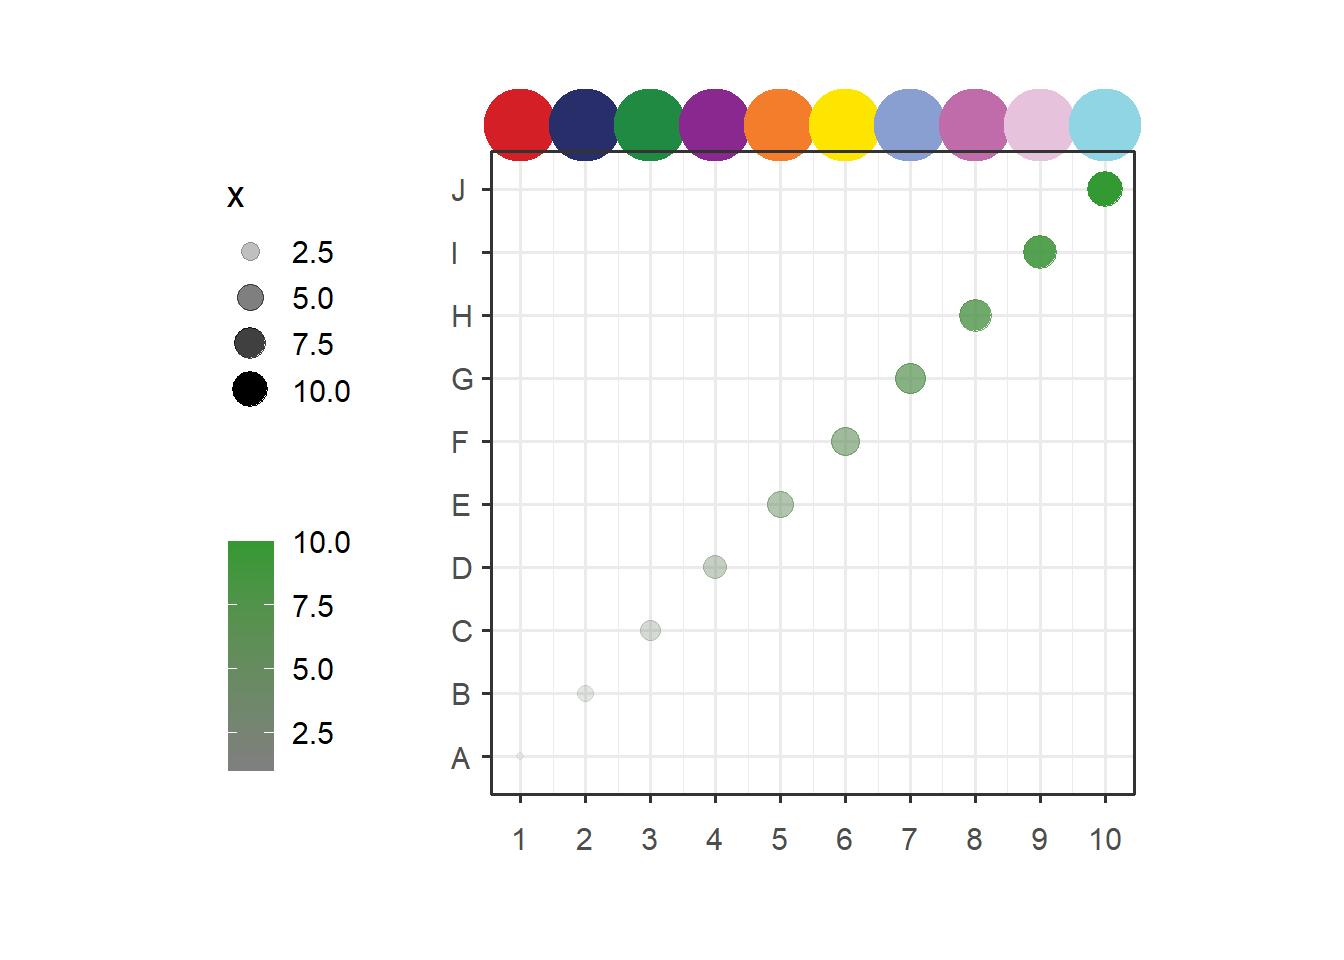
We can define multiple yPosition:
# specify yPosition
annoPoint(object = p,
          annoPos = 'top',
          xPosition = c(1:10),
          yPosition = rep(c(2,4,2,6,4),each = 2))
## [1] "This palatte have 20 colors!"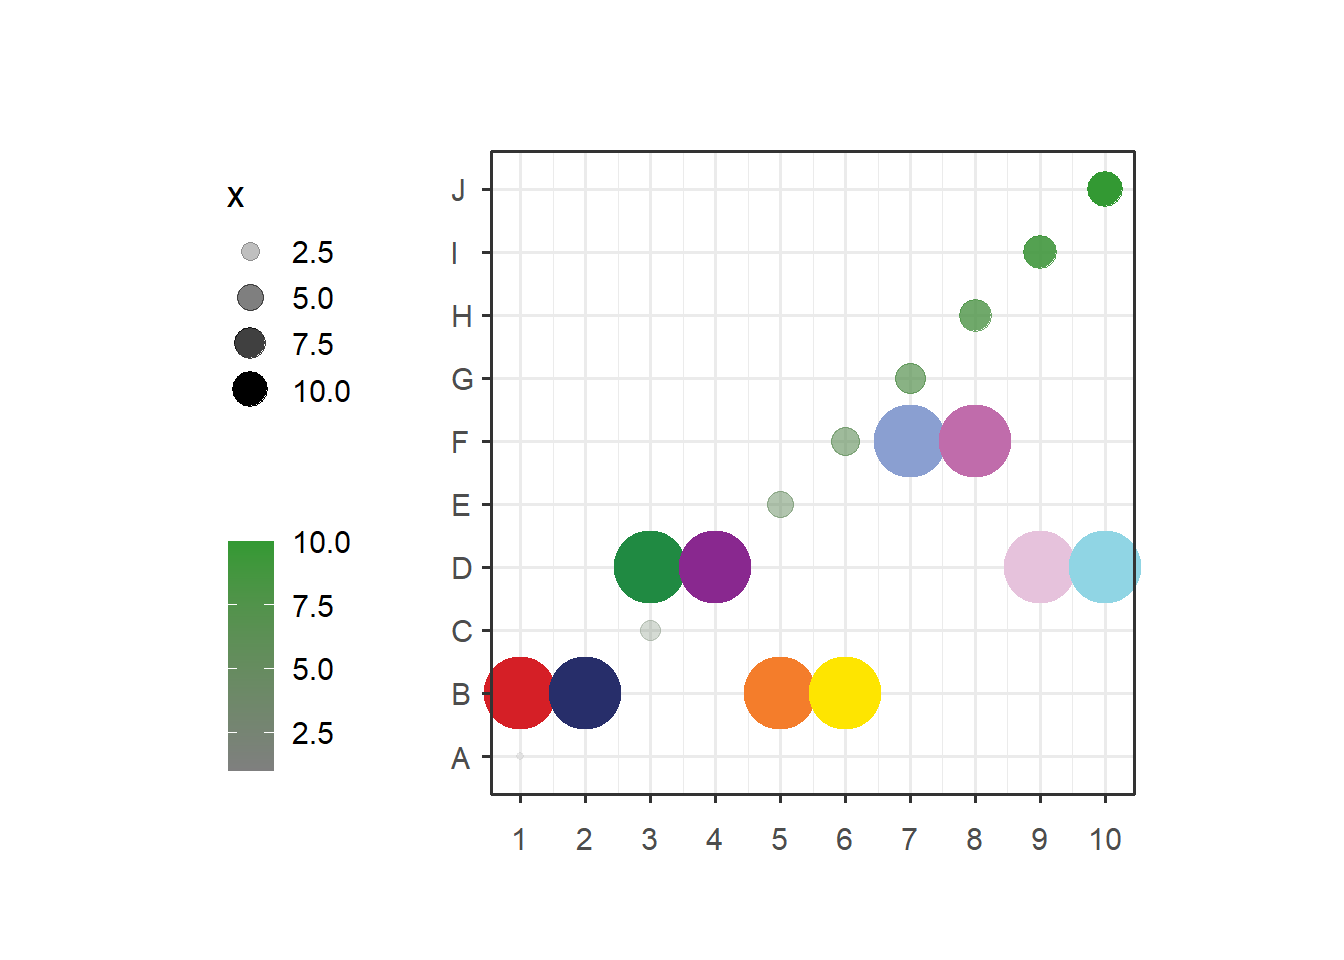
Add to right:
# add right
annoPoint(object = p,
          annoPos = 'right',
          yPosition = c(1:10))
## [1] "This palatte have 20 colors!"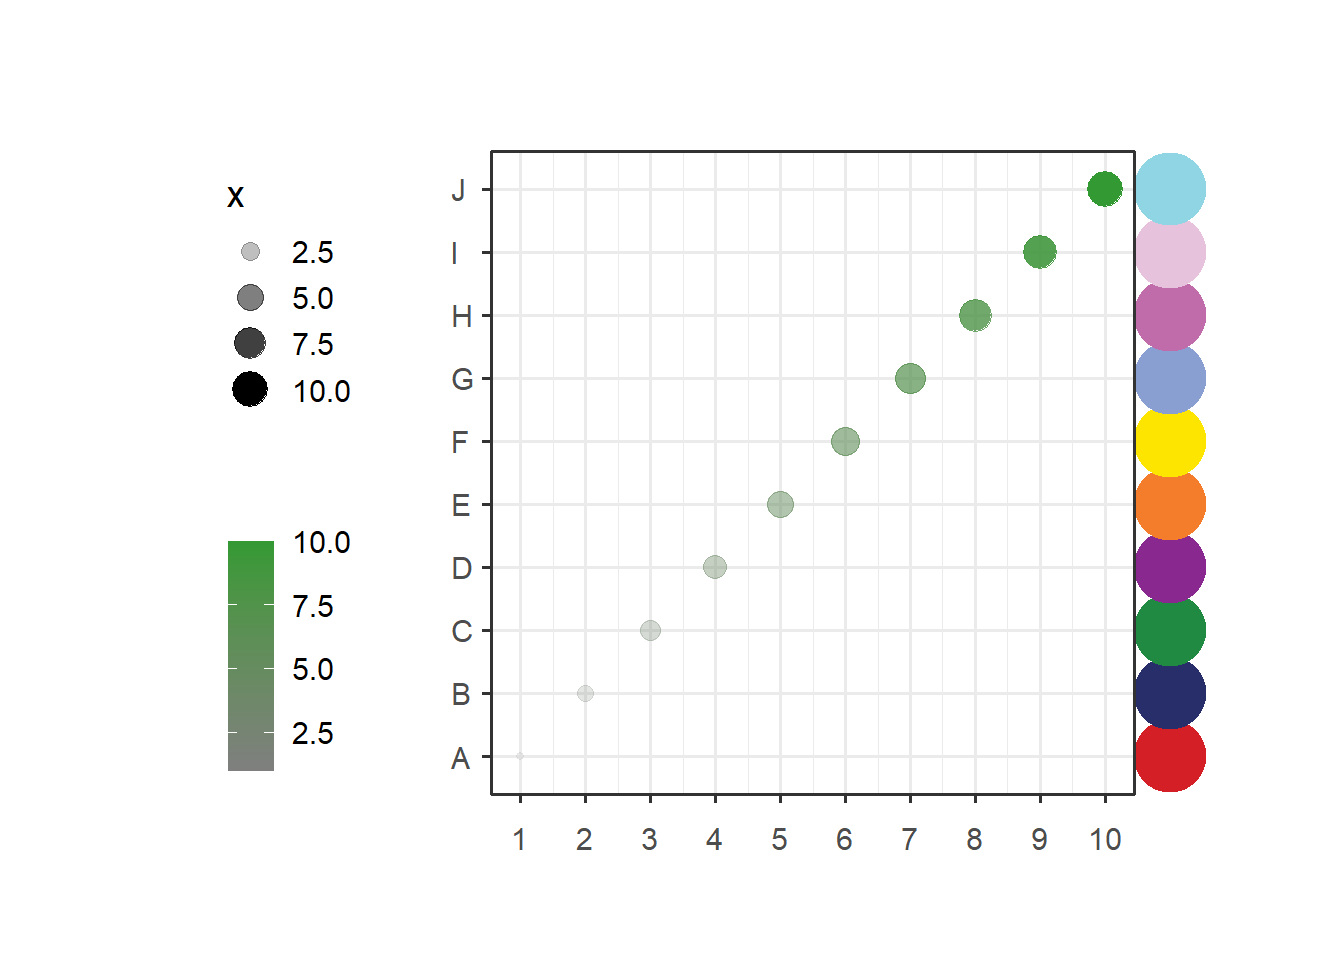
Add to left:
# left
annoPoint(object = p,
          annoPos = 'left',
          yPosition = c(1:10))
## [1] "This palatte have 20 colors!"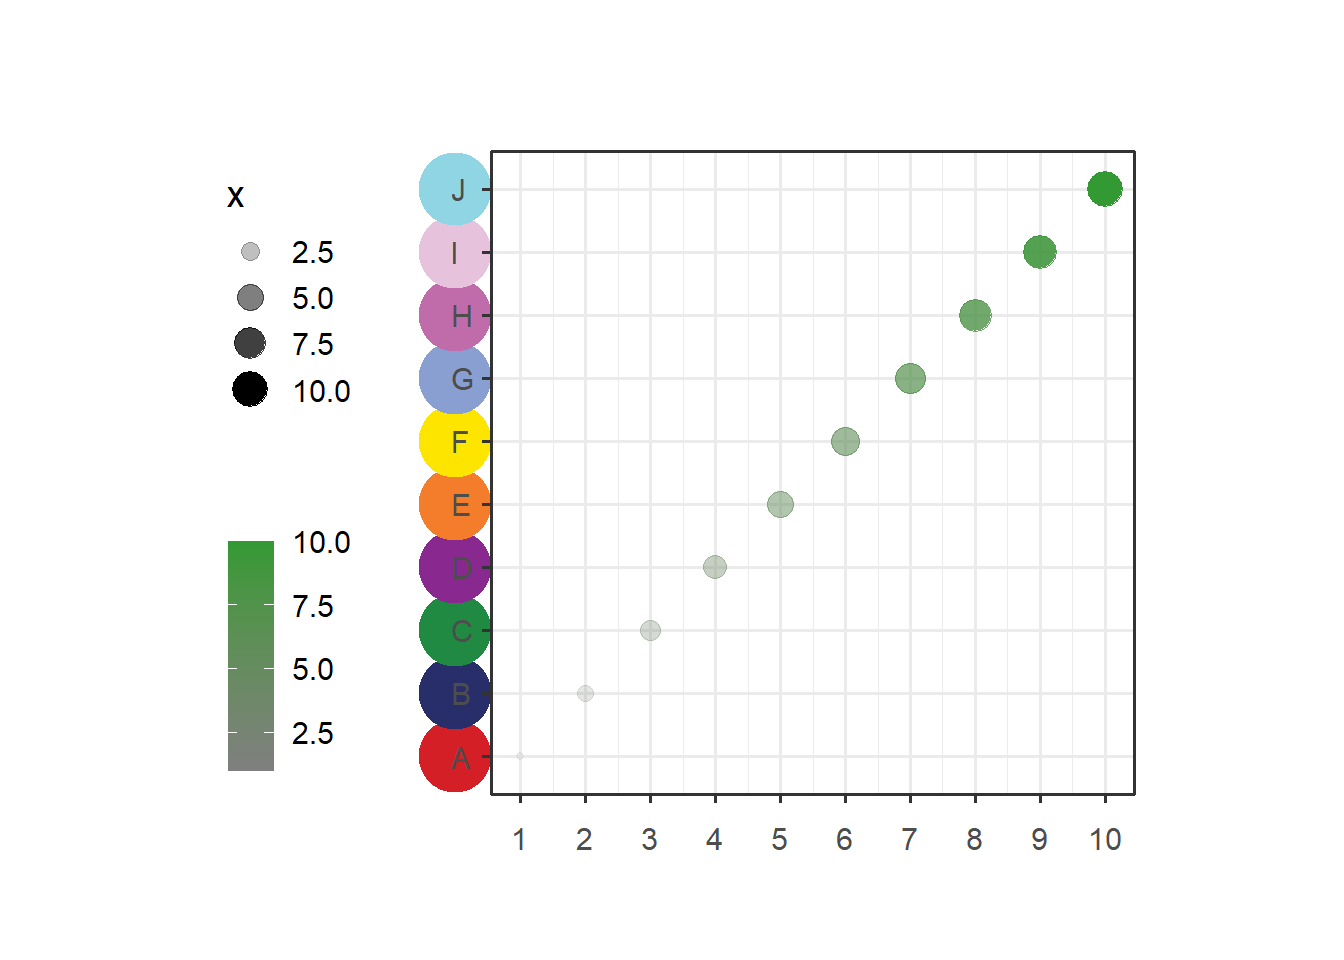
We can supply xPosition to ajust a suitable position:
# supply xPosition to ajust
annoPoint(object = p,
          annoPos = 'right',
          yPosition = c(1:10),
          xPosition = 0.3)
## [1] "This palatte have 20 colors!"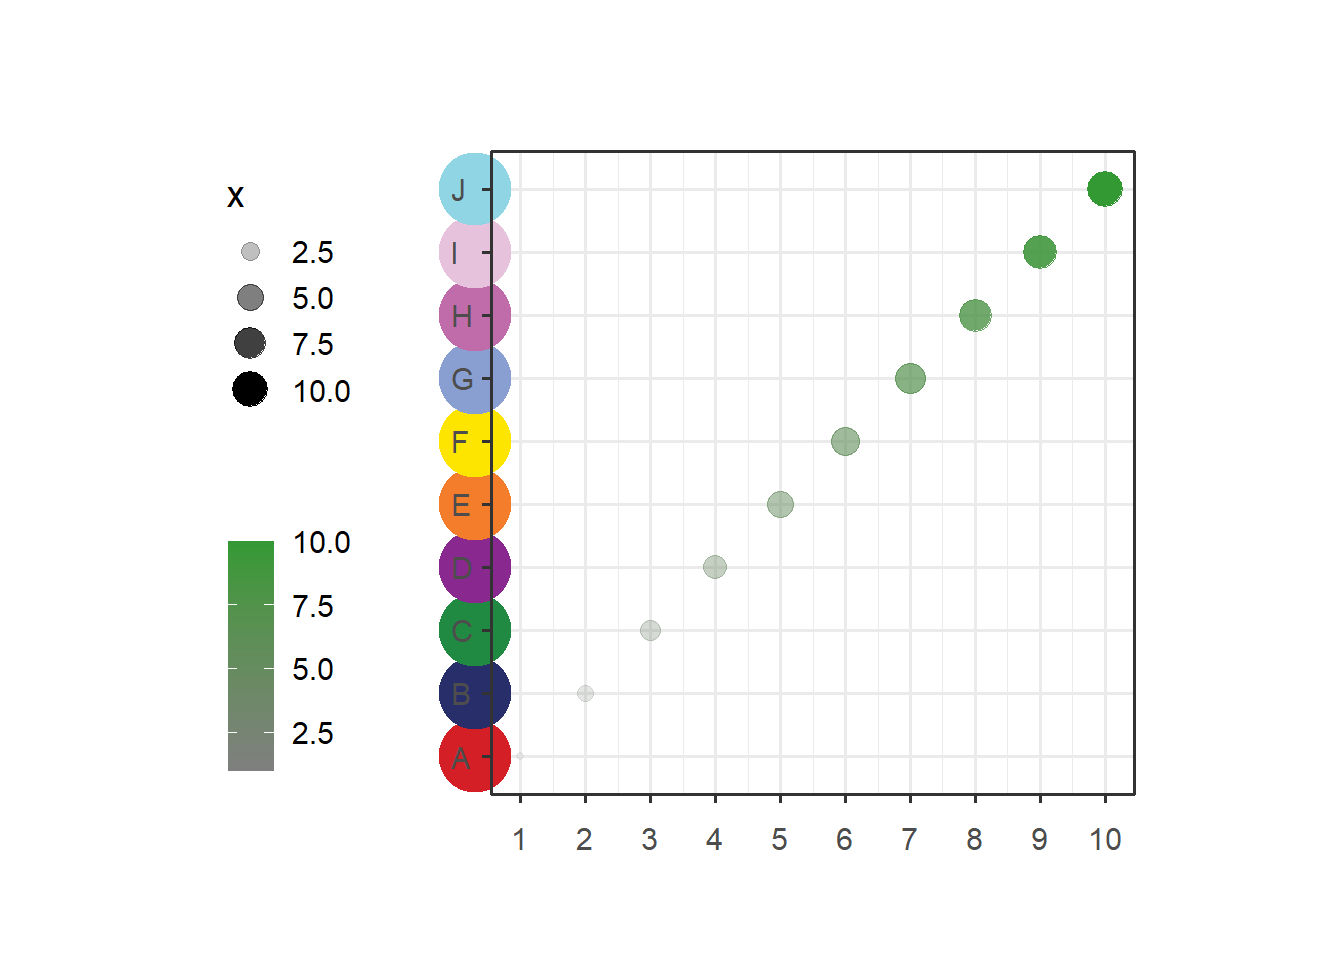
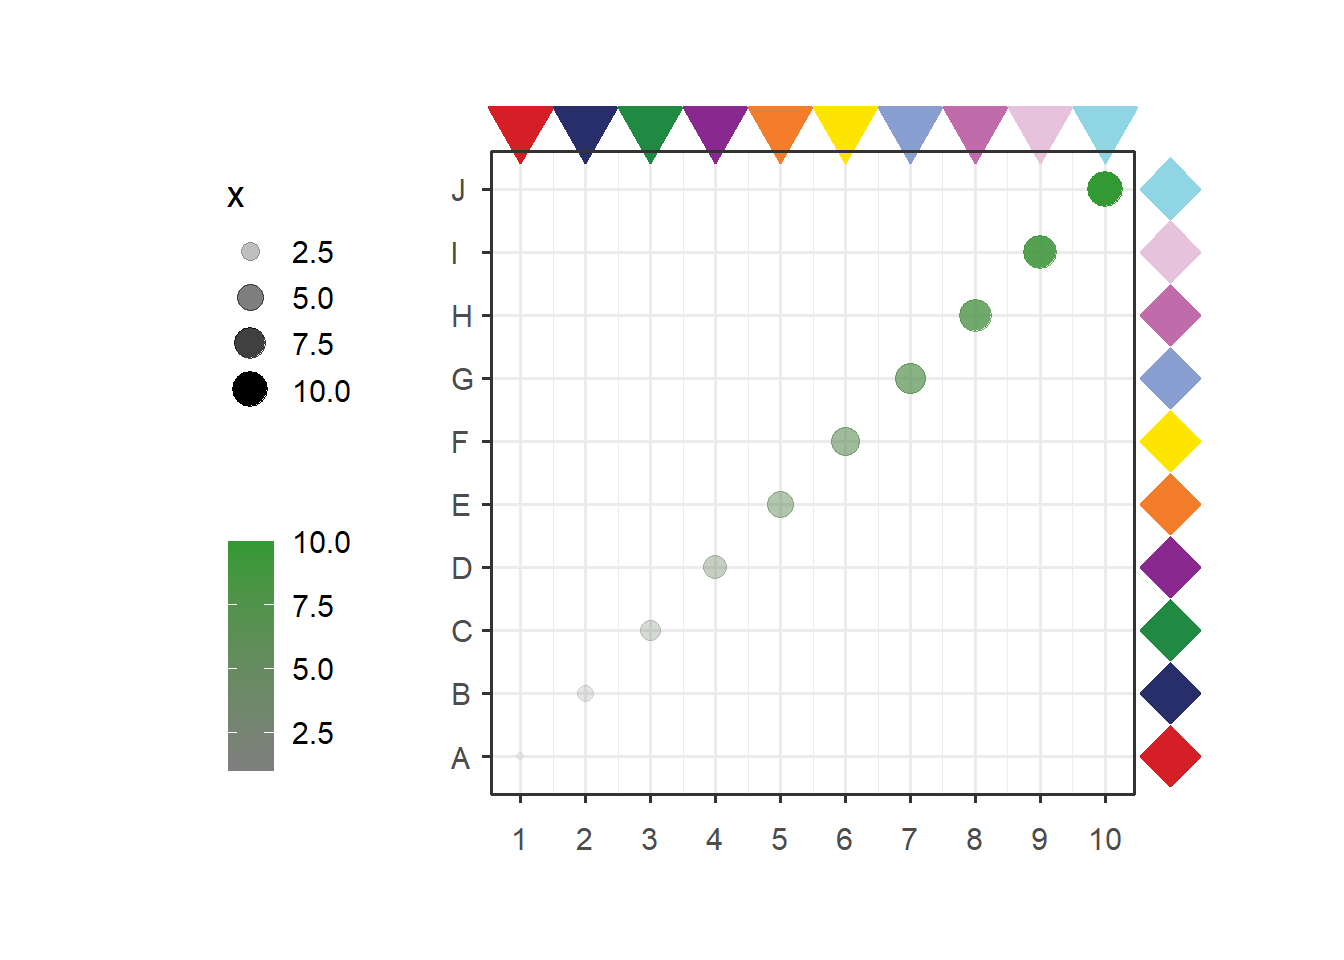
Change point size and shape:
# change point size and shape
annoPoint(object = p,
          annoPos = 'top',
          xPosition = c(1:10),
          ptSize = 2,
          ptShape = 25)
## [1] "This palatte have 20 colors!"
You can also add multiple annotations:
# add multiple annotations
p1 <- annoPoint(object = p,
                annoPos = 'top',
                xPosition = c(1:10),
                ptSize = 2,
                ptShape = 25)
## [1] "This palatte have 20 colors!"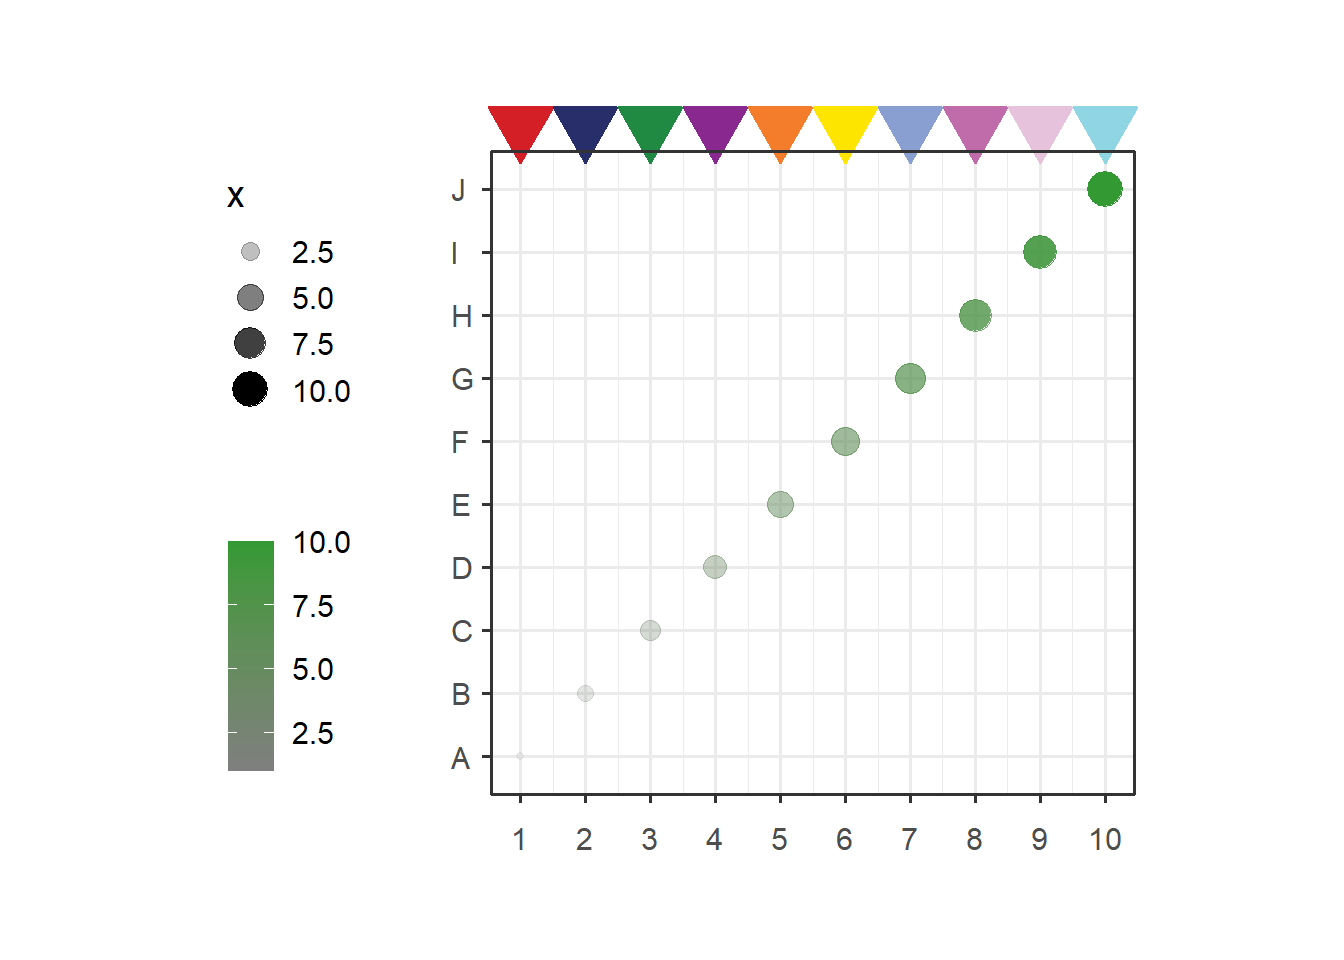
annoPoint(object = p1,
          annoPos = 'right',
          yPosition = c(1:10),
          ptSize = 2,
          ptShape = 23)
## [1] "This palatte have 20 colors!"