library(omicScope)

data("ic")

head(ic[1:3,1:8])

# # A tibble: 3 × 8
#   DATASET NLME_RESULT_ID NLME_CURVE_ID COSMIC_ID CELL_LINE_NAME SANGER_MODEL_ID TCGA_DESC    DRUG_ID
#   <chr>            <dbl>         <dbl>     <dbl> <chr>          <chr>           <chr>          <dbl>
# 1 GDSC2              401      18945558    683667 PFSK-1         SIDM01132       MB              1003
# 2 GDSC2              401      18945796    684052 A673           SIDM00848       UNCLASSIFIED    1003
# 3 GDSC2              401      18946078    684057 ES5            SIDM00263       UNCLASSIFIED    1003

data("exp.anno")

head(exp.anno[1:3,1:8])
#           gene_id gene_name 1287381 1287706 910697 910851 910925 906803
# 1 ENSG00000186092     OR4F5    0.00    0.00   0.00   0.00  0.000   0.00
# 2 ENSG00000187634    SAMD11   19.17    0.13   2.07   8.11  0.090   0.15
# 3 ENSG00000188976 NOC2L 18.25 30.38 25.63 18.03 42.095 25.228 Correlation for drug IC50 and gene expression
8.1 Introduction
The omicScope package includes data from the second version of the GDSC database, comprising drug IC50 values across different cell lines and RNA-seq gene expression data under various drug treatments. Users can perform correlation analysis between gene expression levels and drug IC50 values to explore the relationship between genes and drug resistance.
8.2 Examples
First, we load the drug IC50 data and the gene expression profile data:
Use the gdsc_corplot function to generate a correlation scatter plot. Specify the gene name with the select_gene parameter and the drug name with the drug_name parameter:
gdsc_corplot(select_gene = "METTL3",
             drug_name = "Cisplatin")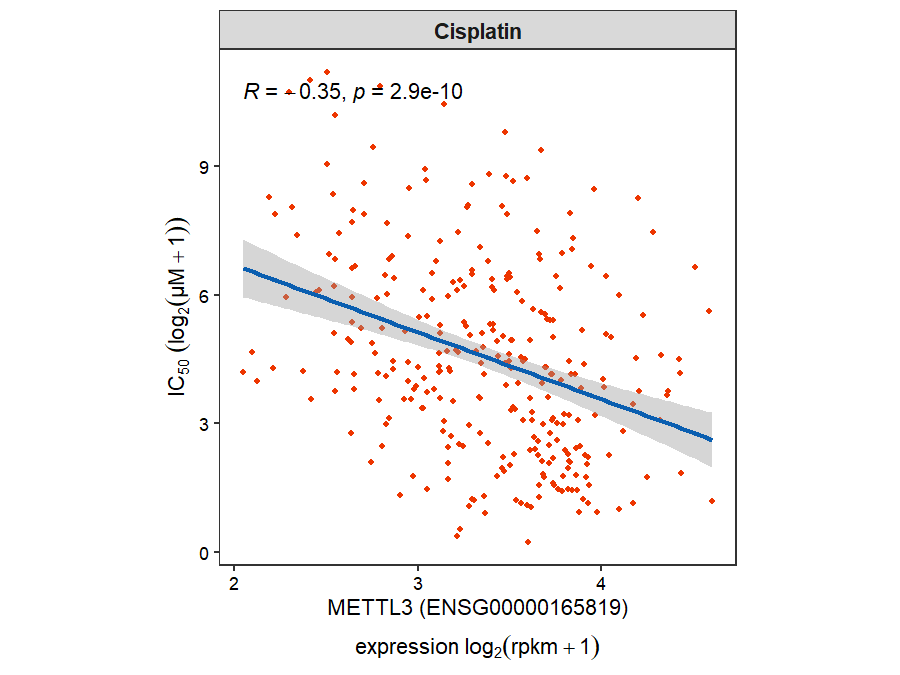
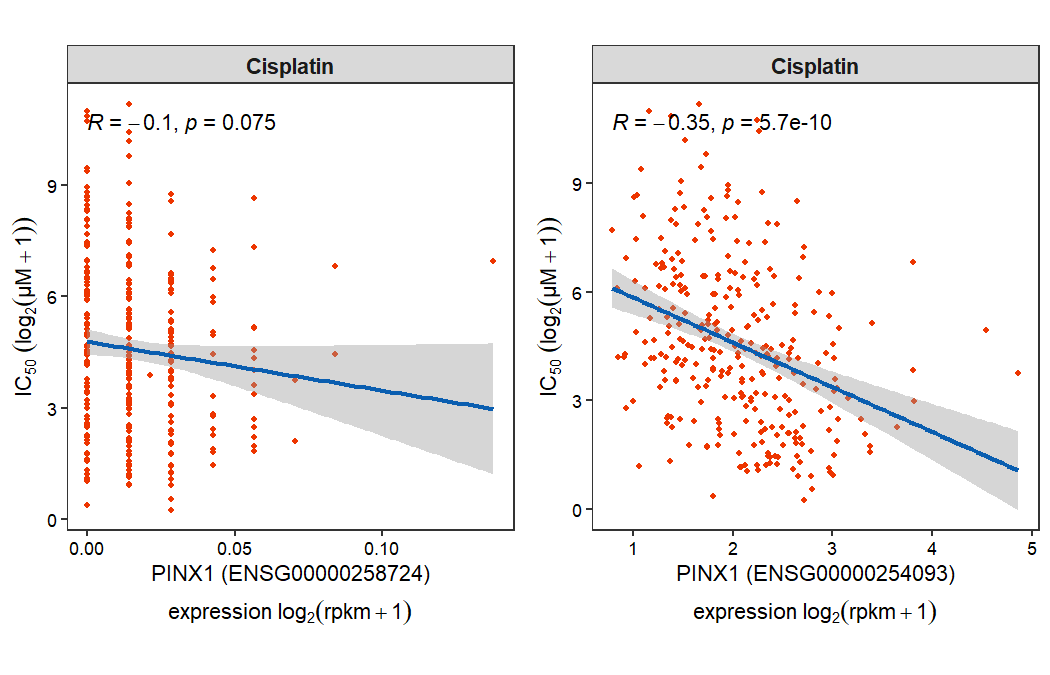
Certain genes may be associated with multiple gene identifiers (e.g., PINX1). In such cases, it is necessary to manually review and select the correct, active identifier for accurate analysis:
gdsc_corplot(select_gene = "PINX1",
             drug_name = "Cisplatin")