4 FeatureCornerAxes
FeatureCornerAxes is used to add corner axis on the left-bottom UMAP/tSNE Featureplot function from seurat plot to view gene expressions.
4.1 examples
See the default plot:
# default
FeatureCornerAxes(object = tmp,reduction = 'umap',
groupFacet = 'orig.ident',
relLength = 0.5,
relDist = 0.2,
features = c("Actb","Ythdc1", "Ythdf2"))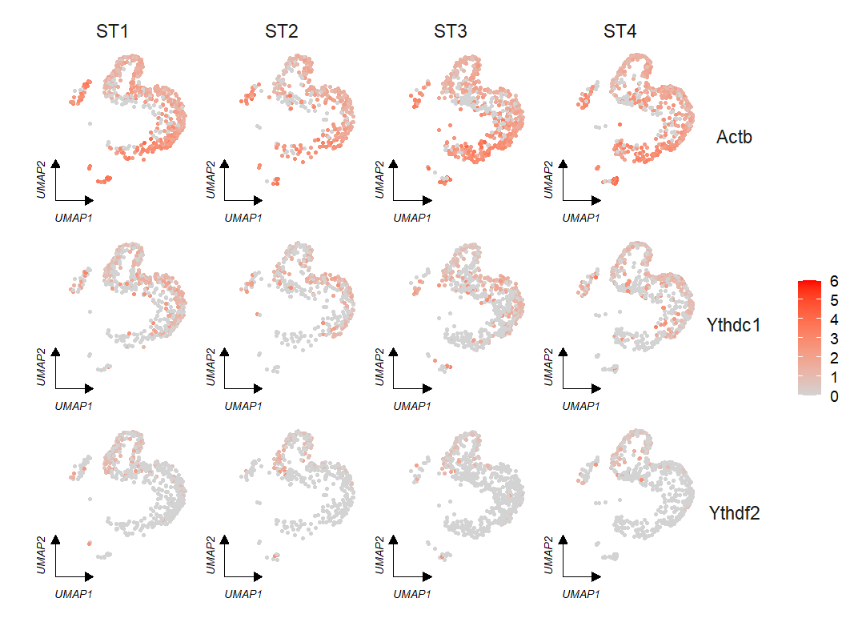 Remove legend:
# remove legend
FeatureCornerAxes(object = tmp,reduction = 'umap',
                  groupFacet = 'orig.ident',
                  relLength = 0.5,
                  relDist = 0.2,
                  features = c("Actb","Ythdc1", "Ythdf2"),
                  show.legend = F)
If we do not split the plot by group, we can set groupFacet = NULL:
# no facet group
FeatureCornerAxes(object = tmp,reduction = 'umap',
groupFacet = NULL,
relLength = 0.5,
relDist = 0.2,
features = c("Actb","Ythdc1", "Ythdf2"),
aspect.ratio = 1)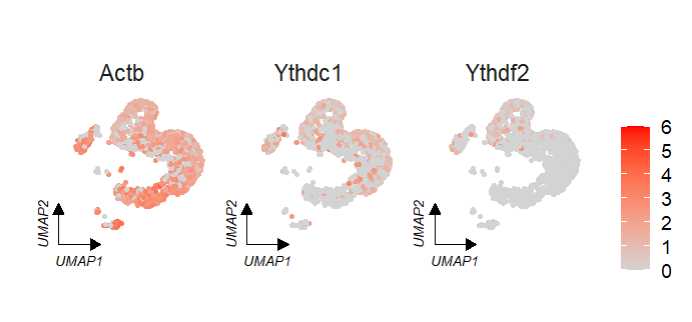 We can specify a group to change the corner axis position:
# specify corner position
p1 <- FeatureCornerAxes(object = tmp,reduction = 'umap',
                        groupFacet = 'orig.ident',
                        relLength = 0.5,
                        relDist = 0.2,
                        aspect.ratio = 1,
                        features = c("Actb","Ythdc1", "Ythdf2"),
                        axes = 'one')

p2 <- FeatureCornerAxes(object = tmp,reduction = 'umap',
                        groupFacet = 'orig.ident',
                        relLength = 0.5,
                        relDist = 0.2,
                        aspect.ratio = 1,
                        features = c("Actb","Ythdc1", "Ythdf2"),
                        axes = 'one',
                        cornerVariable = 'ST4')

# combine
cowplot::plot_grid(p1,p2,ncol = 2,align = 'hv')
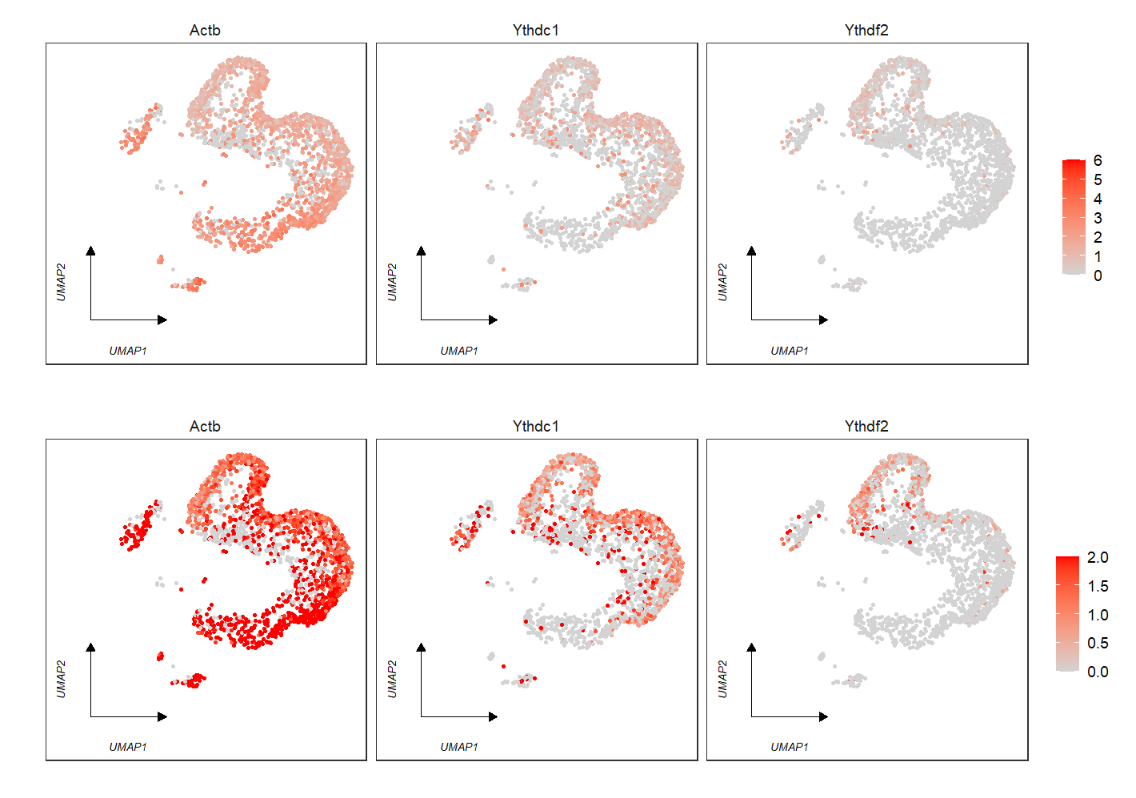
Besides, we can set the color bar value range:
# given a range to plot
p1 <- FeatureCornerAxes(object = tmp,reduction = 'umap',
                        groupFacet = NULL,
                        relLength = 0.5,
                        relDist = 0.2,
                        features = c("Actb","Ythdc1", "Ythdf2"),
                        aspect.ratio = 1,
                        themebg = 'bwCorner')

p2 <- FeatureCornerAxes(object = tmp,reduction = 'umap',
                        groupFacet = NULL,
                        relLength = 0.5,
                        relDist = 0.2,
                        features = c("Actb","Ythdc1", "Ythdf2"),
                        aspect.ratio = 1,
                        themebg = 'bwCorner',
                        minExp = 0,maxExp = 2)

# combine
cowplot::plot_grid(p1,p2,ncol = 1,align = 'hv')