Chapter 4 Parse computeMatrix
ggChIPvis can also parse the deeptools computeMatrix command output data. You can use parseDeeptools function to prepare a list of matrices for retriveData function and visualization can be performed by using ChipVis.
4.1 Test data
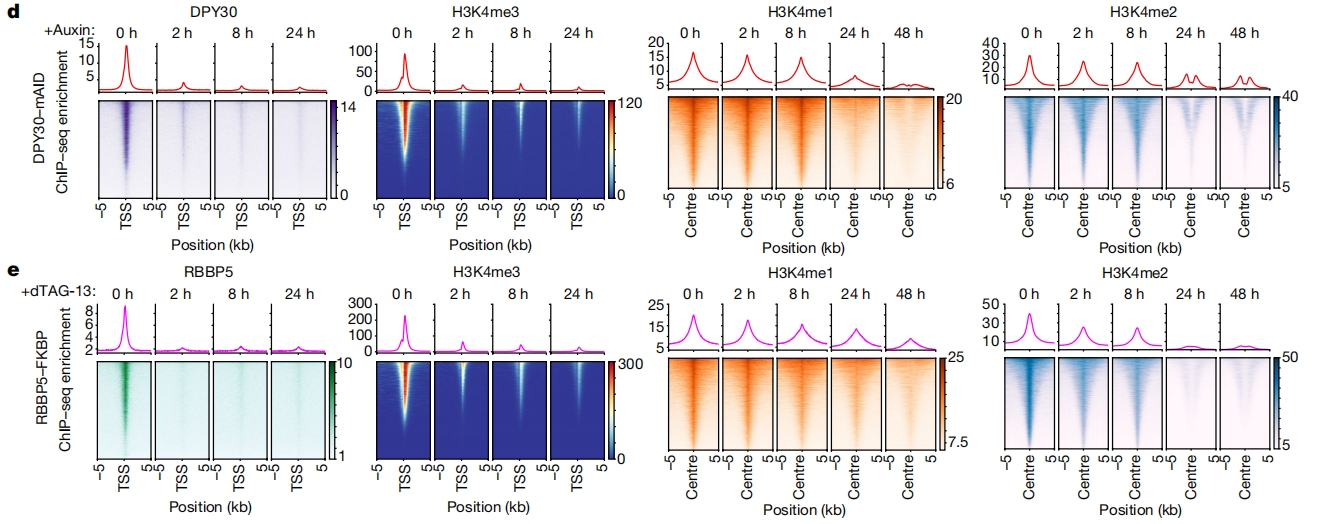
Test data can be fetched from GSE181714. The ralated paper is H3K4me3 regulates RNA polymerase II promoter-proximal pause-release.
The related plot shows below:

4.2 Prepare target genes
setwd("GSE181714_RAW")

getwd()

gtf <- import.gff("../Mus_musculus.GRCm38.102.gtf.gz",format = "gtf") |>
  data.frame() |> filter(type == "gene")

genes <- gtf |> select(seqnames,start,end,gene_id,gene_name,strand) |>
  mutate(seqnames = paste0("chr",seqnames))

write.table(head(genes,5000),file = "genes.bed",
            col.names = F,quote = F,row.names = F,sep = "\t")

pt <- gtf |>
  filter(gene_biotype == "protein_coding") |>
  select(seqnames,start,end,gene_id,gene_name,strand) |>
  mutate(seqnames = paste0("chr",seqnames))

write.table(head(pt,5000),file = "pt_genes.bed",
            col.names = F,quote = F,row.names = F,sep = "\t")

ncd <- gtf |>
  filter(gene_biotype != "protein_coding") |>
  select(seqnames,start,end,gene_id,gene_name,strand) |>
  mutate(seqnames = paste0("chr",seqnames))

write.table(head(ncd,5000),file = "non_pt_genes.bed",
            col.names = F,quote = F,row.names = F,sep = "\t")
4.3 Using computeMatrix and plot data
Then we use computeMatrix to get the normalized data and plot them with deeptools:
4.3.1 reference-point mode
computeMatrix reference-point -p 10 \
--binSize 50 \
--referencePoint TSS \
-a 3000 -b 3000 \
-R genes.bed \
-S GSM5513870_H3K4me3_RBBP5FKBP_0h.bw GSM5513872_H3K4me3_RBBP5FKBP_2h.bw GSM5513873_H3K4me3_RBBP5FKBP_8h.bw GSM5513871_H3K4me3_RBBP5FKBP_24h.bw \
--skipZeros \
-o refPoint-data.gz

# plot
plotHeatmap -m refPoint-data.gz \
--missingDataColor 1 \
--colorList 'white,#0066CC' \
--heatmapHeight 12 \
-o refPoint-heatmap.pdf
4.3.2 scale-regions mode
computeMatrix scale-regions -p 10 \
--binSize 50 \
--regionBodyLength 5000 \
-a 3000 -b 3000 \
-R pt_genes.bed non_pt_genes.bed \
-S GSM5513870_H3K4me3_RBBP5FKBP_0h.bw GSM5513872_H3K4me3_RBBP5FKBP_2h.bw GSM5513873_H3K4me3_RBBP5FKBP_8h.bw GSM5513871_H3K4me3_RBBP5FKBP_24h.bw \
--skipZeros \
-o scaleRegion-data.gz

# plot
plotHeatmap -m scaleRegion-data.gz \
--missingDataColor 1 \
--colorList 'white,#0066CC' \
--heatmapHeight 12 \
-o scaleRegion-heatmap.pdf
4.4 Parse deeptools output with reference-point mode
4.4.1 Extract data
# parse deeptools output
deep_mat <- parseDeeptools(deeptools_output = "refPoint-data.gz")

# attributes
class(deep_mat[[1]])
# [1] "deeptoolsMat" "matrix"

attributes(deep_mat[[1]])
# $dim
# [1] 5000  120
#
# $upstream
# [1] 3000
#
# $downstream
# [1] 3000
#
# $extend
# [1] 3000 3000
#
# $upstream_index
# [1]  1  2  3  4  5  6  7  8  9 10 11 12 13 14 15 16 17 18 19 20 21 22 23 24 25 26 27 28 29 30 31 32 33
# [34] 34 35 36 37 38 39 40 41 42 43 44 45 46 47 48 49 50 51 52 53 54 55 56 57 58 59 60
#
# $target_index
# integer(0)
#
# $downstream_index
# [1]  61  62  63  64  65  66  67  68  69  70  71  72  73  74  75  76  77  78  79  80  81  82  83  84
# [25]  85  86  87  88  89  90  91  92  93  94  95  96  97  98  99 100 101 102 103 104 105 106 107 108
# [49] 109 110 111 112 113 114 115 116 117 118 119 120
#
# $sample_name
# [1] "GSM5513870_H3K4me3_RBBP5FKBP_0h"
#
# $group_labels
# [1] "genes"
#
# $group_numbers
# [1] 5000
#
# $class
# [1] "deeptoolsMat" "matrix"

# get data
mat_df <- retriveData(mat.list = deep_mat,rm.extreme.value = T,
                      sample.names = c("0 h","2 h","8 h","24 h"),
                      group.sample = rep("H3H4me3",4))
4.4.2 Profile plot

Control facet layer and add nested line:
ChipVis(object = mat_df,plot.type = "profile",
        sample.order = c("0 h","2 h","8 h","24 h"),
        facet_profile_params = list(nest_line = element_line(linetype = 1)),
        theme_params = list(strip.background = element_blank(),
                            ggh4x.facet.nestline = element_line(linewidth = 1,
                                                                colour = "black")))
4.4.3 Heatmap plot

Control facet layer and add nested line:
ChipVis(object = mat_df,plot.type = "heatmap",
        sample.order = c("0 h","2 h","8 h","24 h"),
        facet_heatmap_params = list(nest_line = element_line(linetype = 1)),
        theme_params = list(strip.background = element_blank(),
                            ggh4x.facet.nestline = element_line(linewidth = 1,
                                                                colour = "black")))
Using another heatmap rank method:
mat_df1 <- retriveData(mat.list = deep_mat,rm.extreme.value = T,
                       sample.names = c("0 h","2 h","8 h","24 h"),
                       group.sample = rep("H3H4me3",4),
                       heatmap_rank_method = "weighting")

ChipVis(object = mat_df1,plot.type = "heatmap",
        sample.order = c("0 h","2 h","8 h","24 h"),
        facet_heatmap_params = list(nest_line = element_line(linetype = 1)),
        theme_params = list(strip.background = element_blank(),
                            ggh4x.facet.nestline = element_line(linewidth = 1,
                                                                colour = "black")))
Change heatmap color:
ChipVis(object = mat_df1,plot.type = "both",
        sample.order = c("0 h","2 h","8 h","24 h")) +
  scale_fill_gradient(low = "white",high = "#713ABE",name = "signal")
4.5 Parse deeptools output with scale-regions mode
4.5.1 Extract data
# parse deeptools output
deep_mat <- parseDeeptools(deeptools_output = "scaleRegion-data.gz")

# attributes
class(deep_mat[[1]])
attributes(deep_mat[[1]])

mat_df <- retriveData(mat.list = deep_mat,rm.extreme.value = T,
                      heatmap_rank_method = "weighting",
                      sample.names = c("0 h","2 h","8 h","24 h"),
                      group.sample = rep("H3H4me3",4))
4.5.2 Profile plot
ChipVis(object = mat_df,plot.type = "profile",
        sample.order = c("0 h","2 h","8 h","24 h"),
        facet_profile_params = list(nest_line = element_line(linetype = 1)),
        theme_params = list(strip.background = element_blank(),
                            ggh4x.facet.nestline = element_line(linewidth = 1,
                                                                colour = "black")))
4.5.3 Heatmap plot
ChipVis(object = mat_df,plot.type = "heatmap",
        sample.order = c("0 h","2 h","8 h","24 h"),
        facet_heatmap_params = list(nest_line = element_line(linetype = 1)),
        theme_params = list(strip.background = element_blank(),
                            ggh4x.facet.nestline = element_line(linewidth = 1,
                                                                colour = "black")))
