Chapter 9 Circular GSEA plot
There is another way to visualize multiple terms of GSEA plot with circular graphic.
First get a enrichment object:
library(ggplot2)
library(org.Hs.eg.db)
library(clusterProfiler)
library(dplyr)
library(GseaVis)

# load test data
data(geneList, package="DOSE")


gse <- gseGO(geneList = geneList,
             ont = "BP",
             keyType = "ENTREZID",
             OrgDb = org.Hs.eg.db)

gse <- setReadable(x = gse,OrgDb = org.Hs.eg.db,keyType = "ENTREZID")

df_gse <- data.frame(gse)
geneSetID <- sample(df_gse$ID,size = 5)
Default plot:

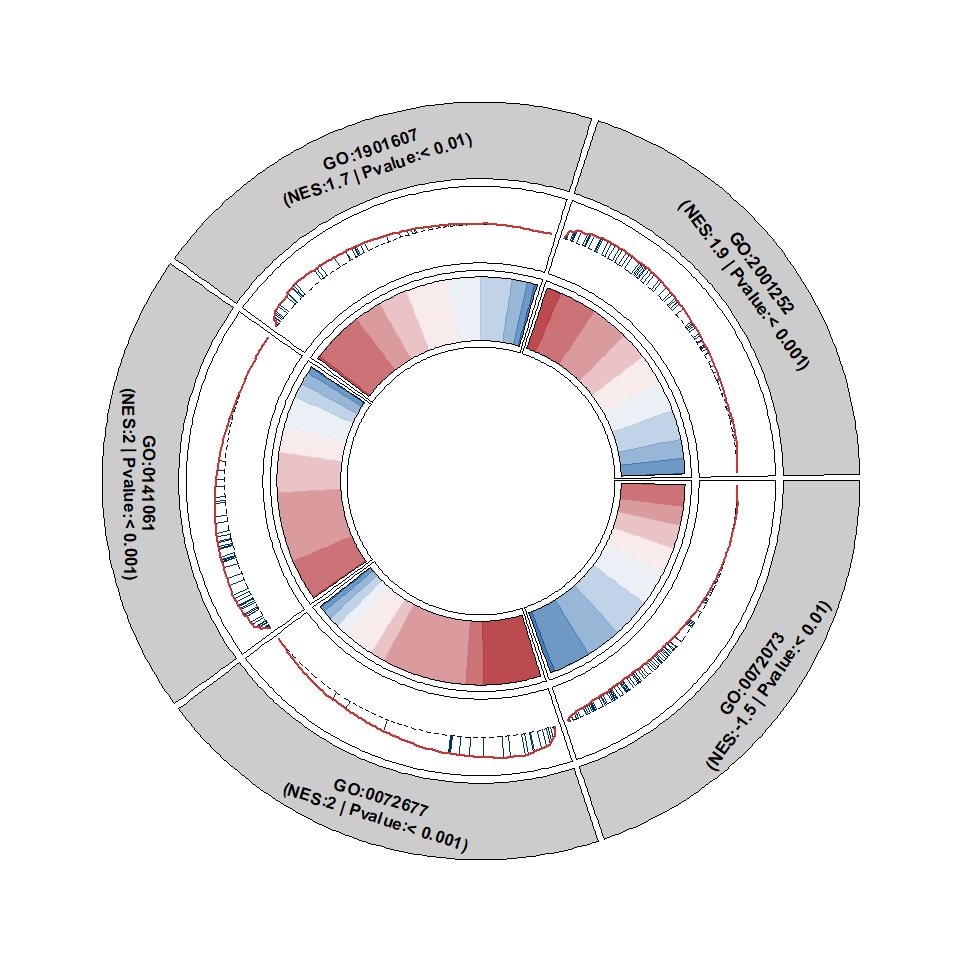
Fit the term label into circular:

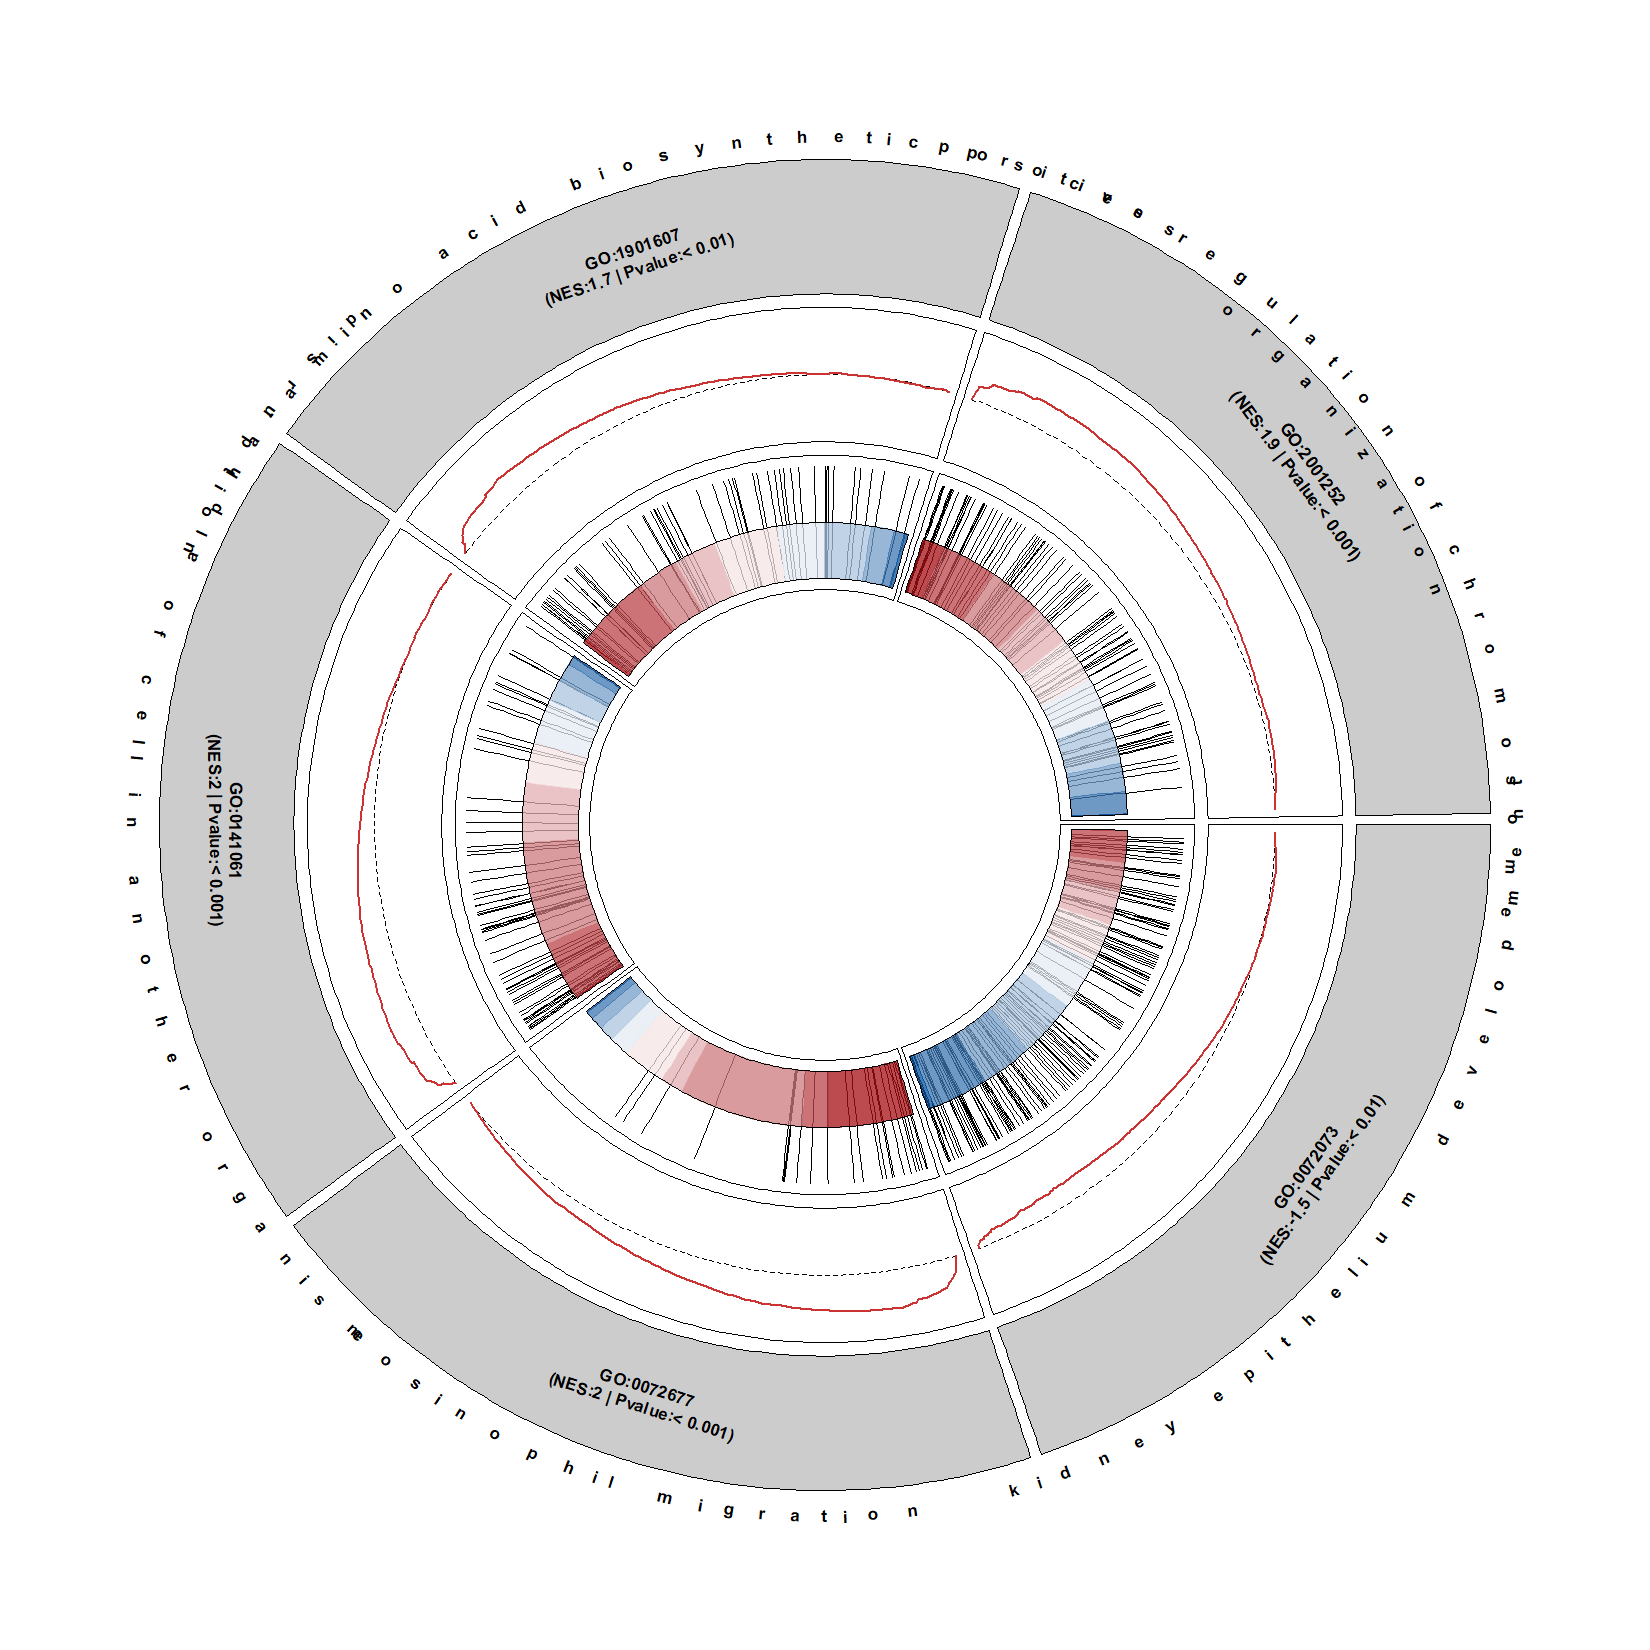
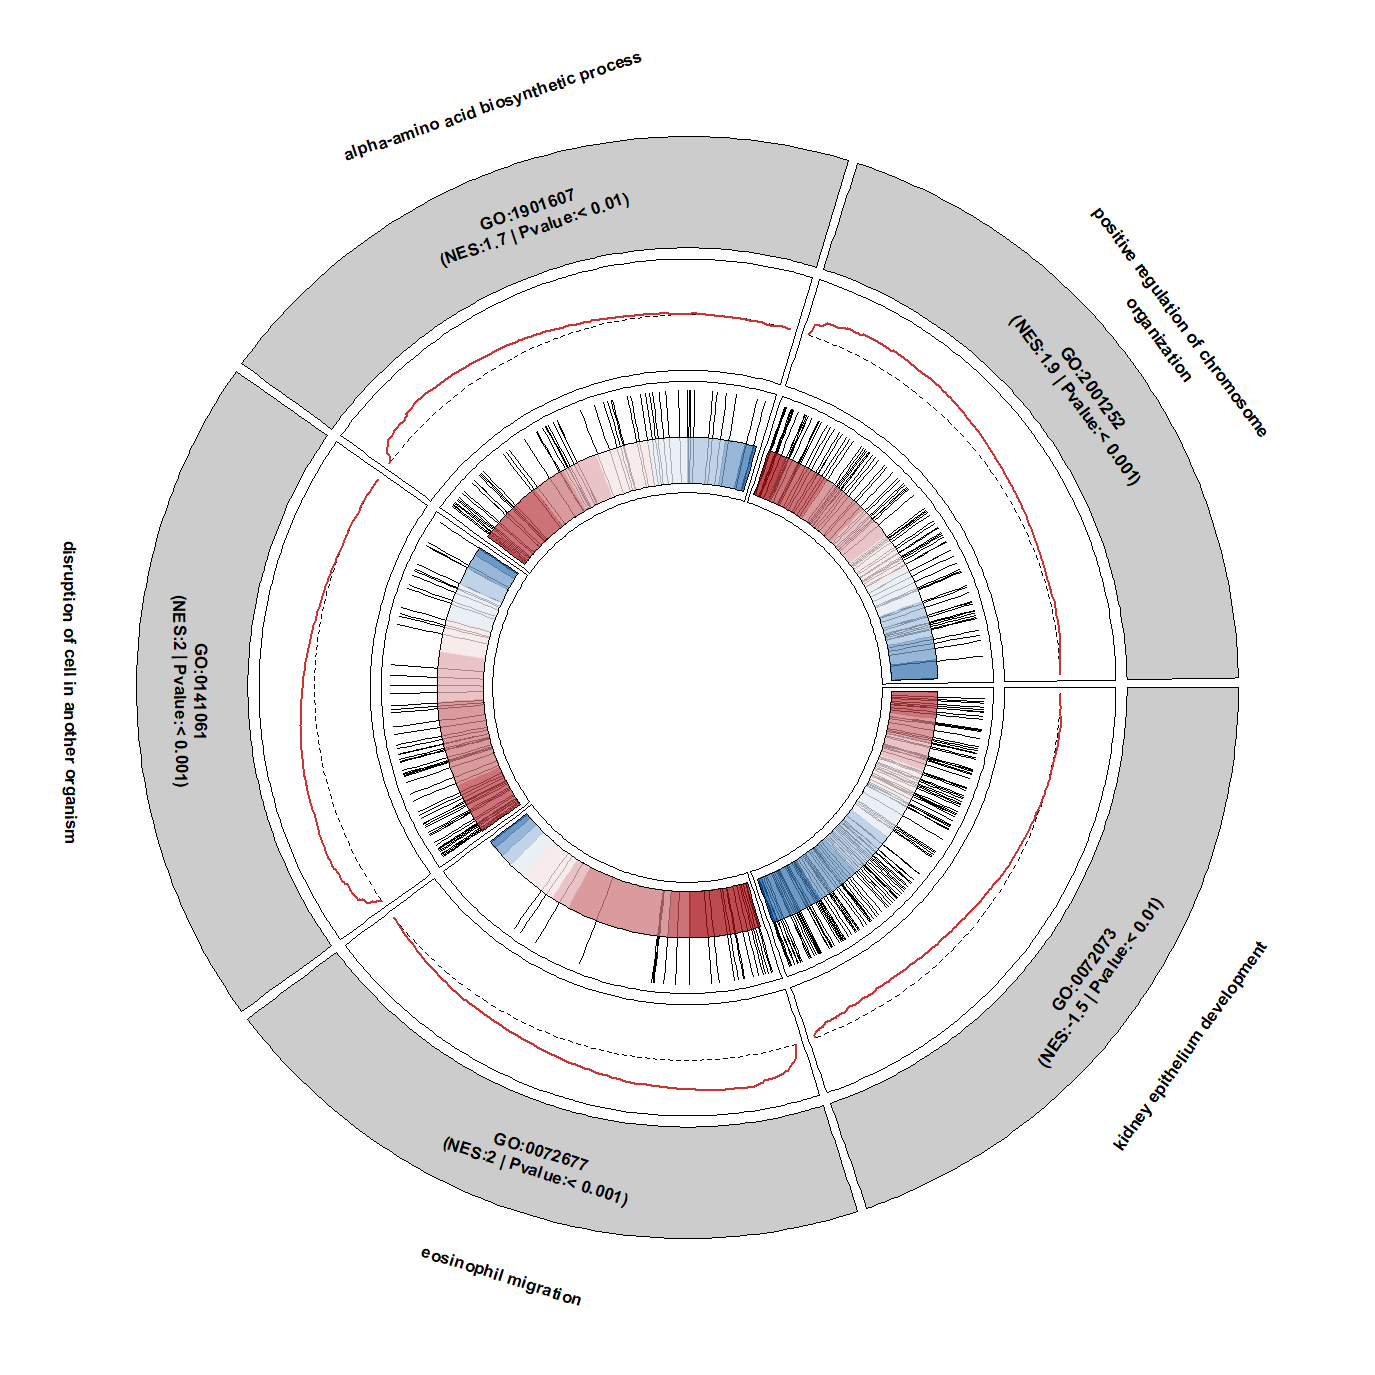
Add term description:
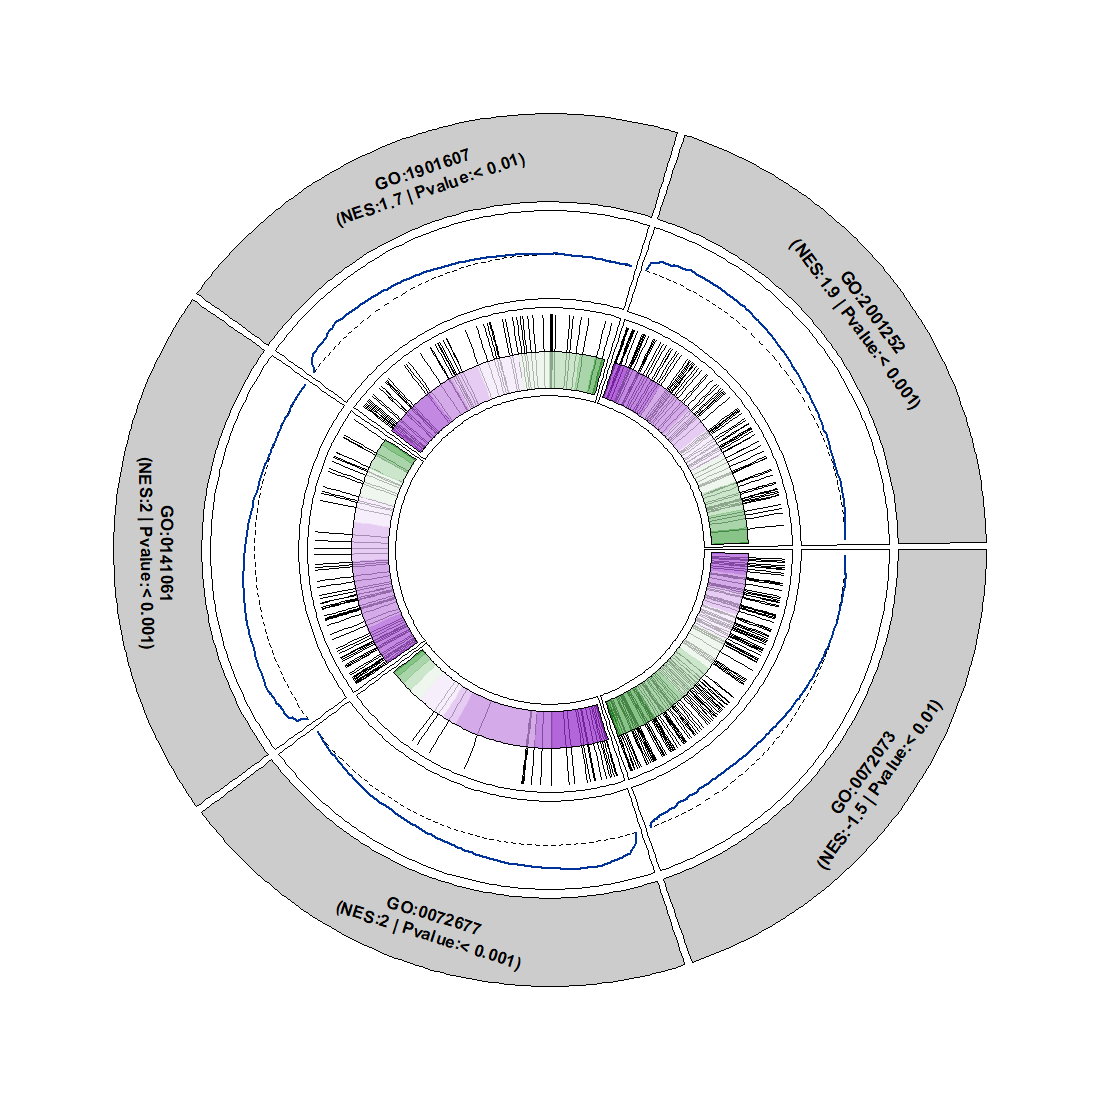
No circular for term name:
circGsea(object = gse,
         geneSetID = geneSetID,
         addDescription = T,
         descriptionFacing = "outside",
         descripShift = 1.5)
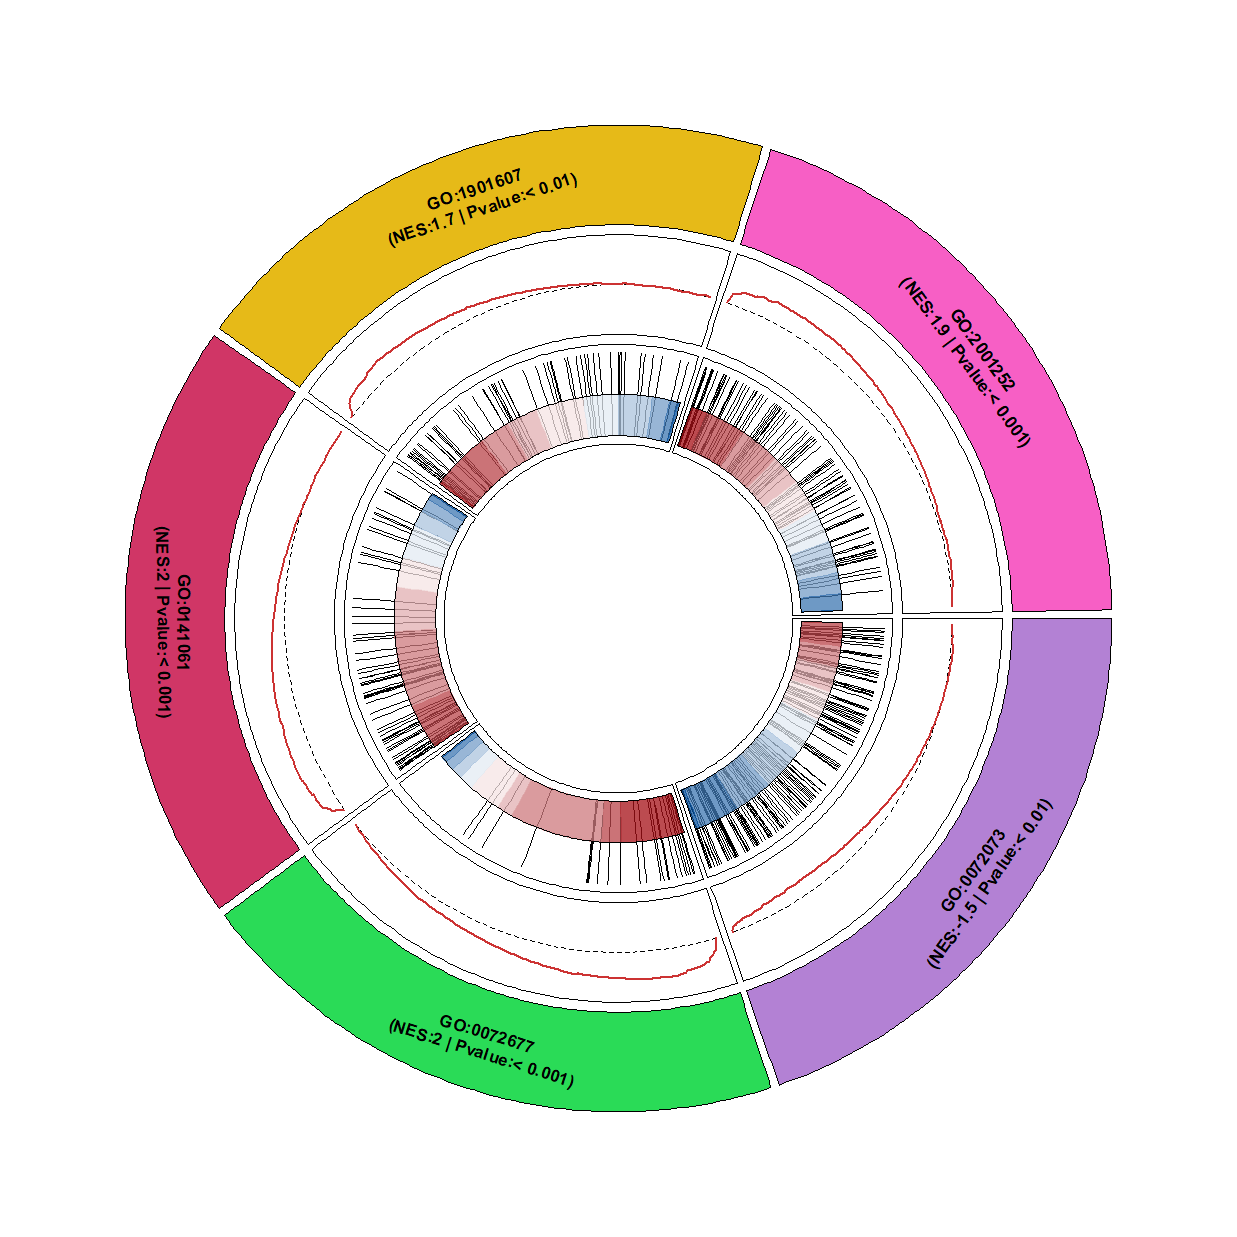
Change background color:
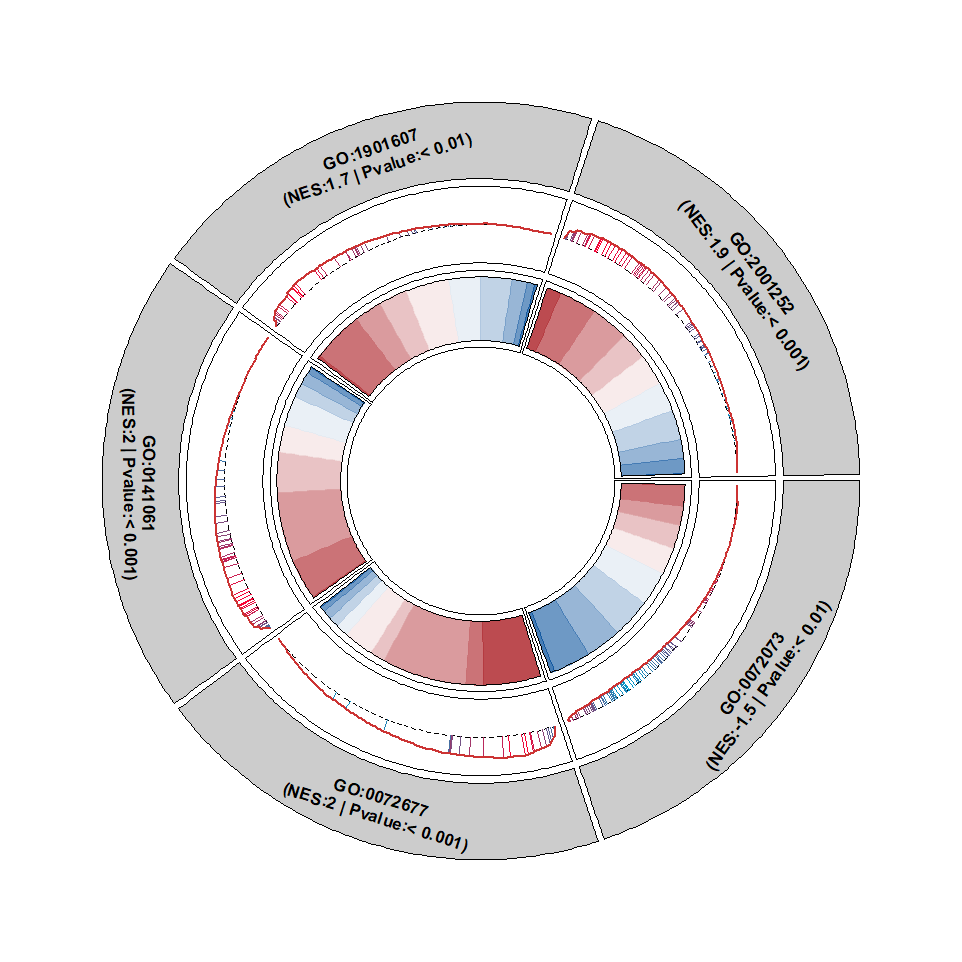
Change heatmap color:

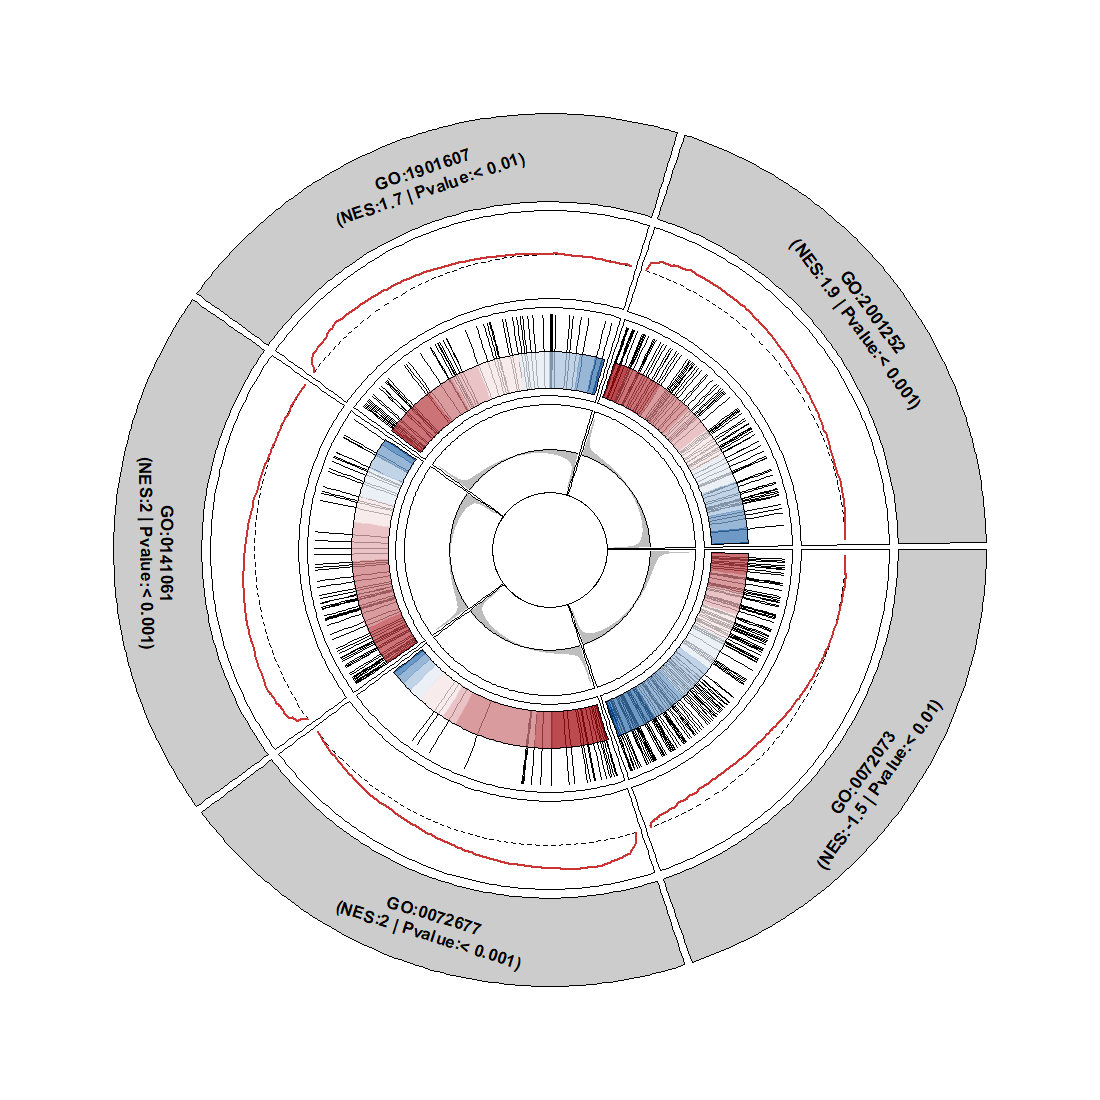
Change curve color:
Add gene rank(this runs slowly):
Merge gene rank segments into curve plot:
Add points:
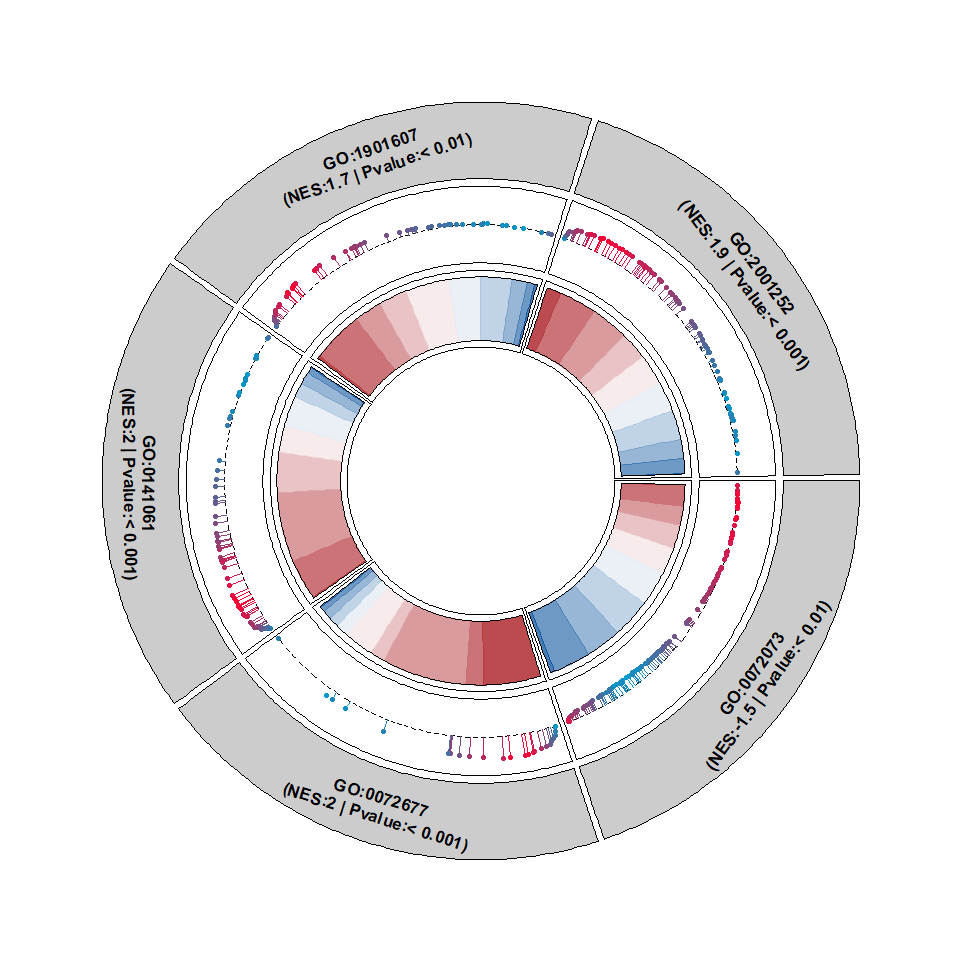
Change the segment color:
Put the segment at center:
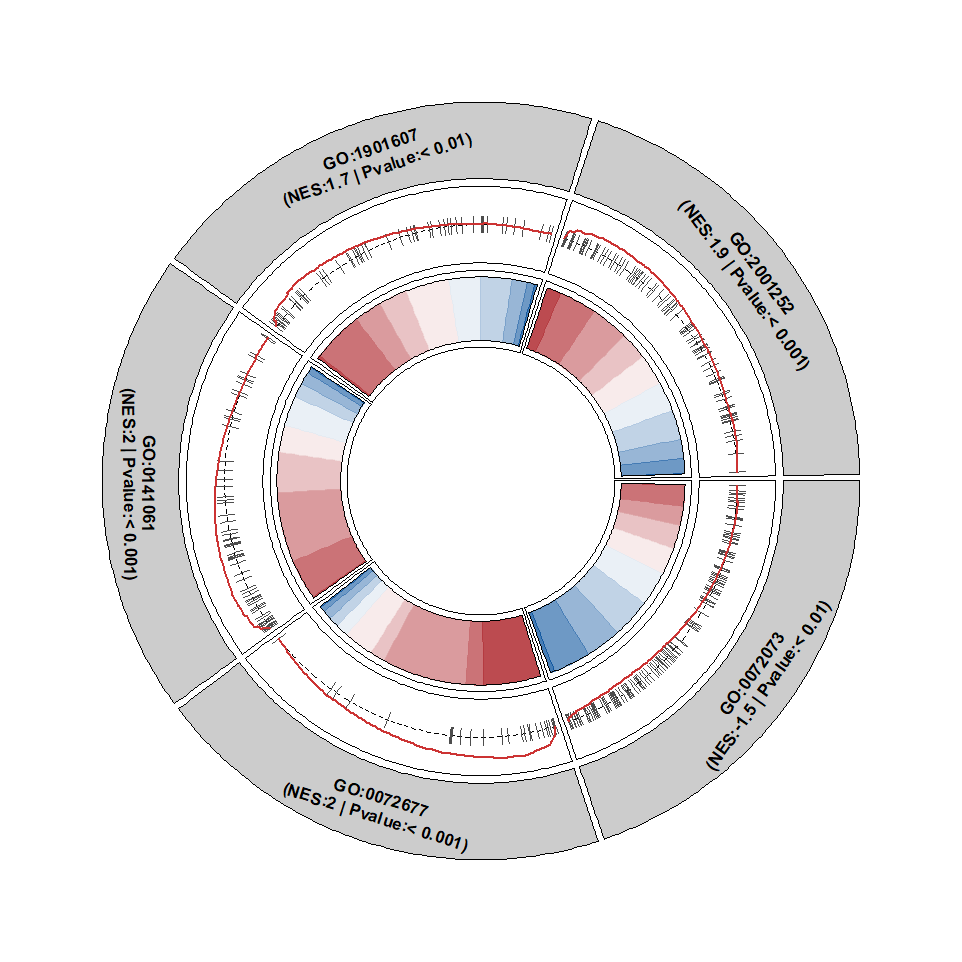
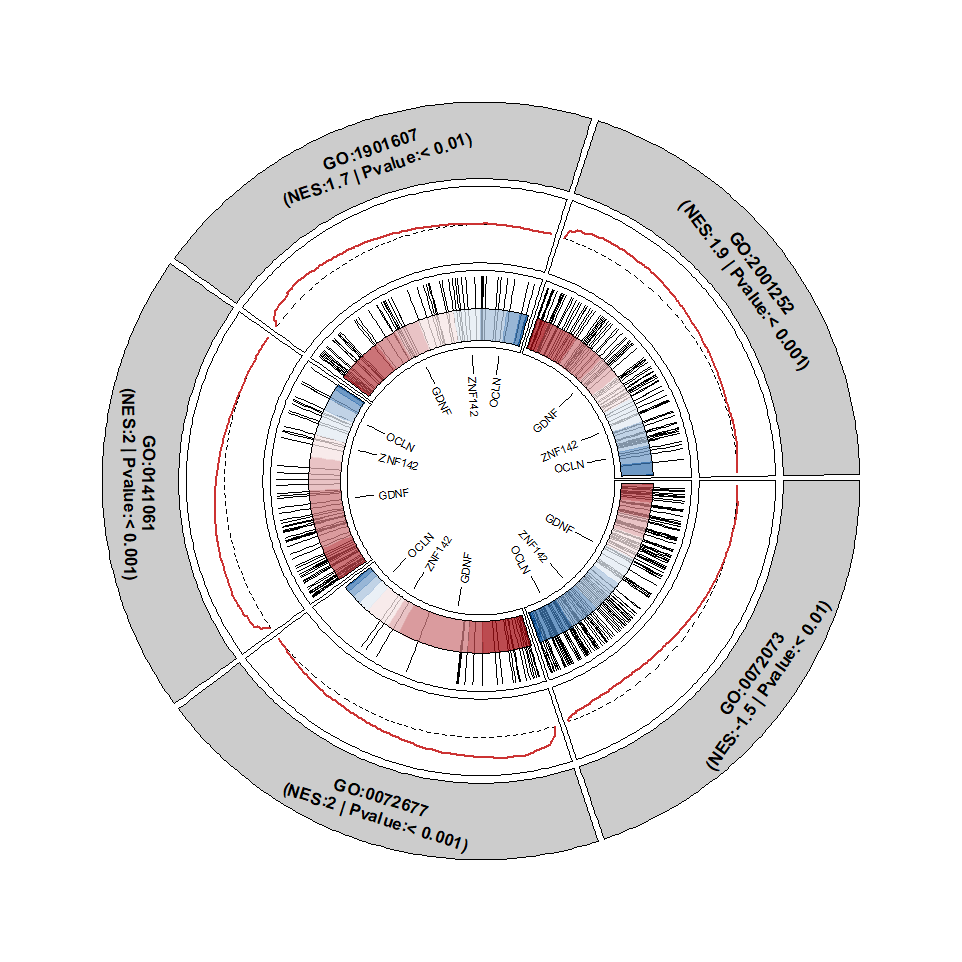
Add gene labels:
mgene <- sample(gse@gene2Symbol,size = 3)

circGsea(object = gse,
         geneSetID = geneSetID,
         markGene = mgene)