Chapter 8 Transform data frame to gseaResult
A data frame containg the GSEA results can not be ploted with enrichplot functions. enrichplot only recgnizes gseaResult object. So it is a problem to re-plot data if you do not save gseaResult object when you do enrichment analysis. Here we supply functions dfGO2gseaResult and dfKEGG2gseaResult can convert back to gseaResult object. This allows you do varous plots on this object.
First we do enrichment analysis:
library(clusterProfiler)
library(org.Hs.eg.db)
library(enrichplot)
library(GseaVis)

# load test data
data(geneList, package="DOSE")

# check
head(geneList)
# 4312     8318    10874    55143    55388      991
# 4.572613 4.514594 4.418218 4.144075 3.876258 3.677857

# KEGG enrich
kk <- gseKEGG(geneList     = geneList,
              organism     = 'hsa',
              minGSSize    = 120,
              pvalueCutoff = 0.05,
              verbose      = FALSE)

go <- gseGO(geneList = geneList,
            ont = "BP",
            keyType = "ENTREZID",
            OrgDb = org.Hs.eg.db,
            pvalueCutoff = 0.05)

KK_df <- data.frame(kk)

# check
head(KK_df[1:3,1:5])
#                ID                             Description setSize enrichmentScore      NES
# hsa04110 hsa04110                              Cell cycle     139       0.6637551 2.827249
# hsa05169 hsa05169            Epstein-Barr virus infection     193       0.4335010 1.927343
# hsa05166 hsa05166 Human T-cell leukemia virus 1 infection     202       0.3893613 1.748318

go_df <- data.frame(go)

# check
head(go_df[1:3,1:5])
#                    ID                          Description setSize enrichmentScore      NES
# GO:0000070 GO:0000070 mitotic sister chromatid segregation     151       0.6795449 2.956225
# GO:0000819 GO:0000819         sister chromatid segregation     184       0.6542189 2.891093
# GO:0098813 GO:0098813       nuclear chromosome segregation     236       0.6307606 2.868515
8.1 dfGO2gseaResult
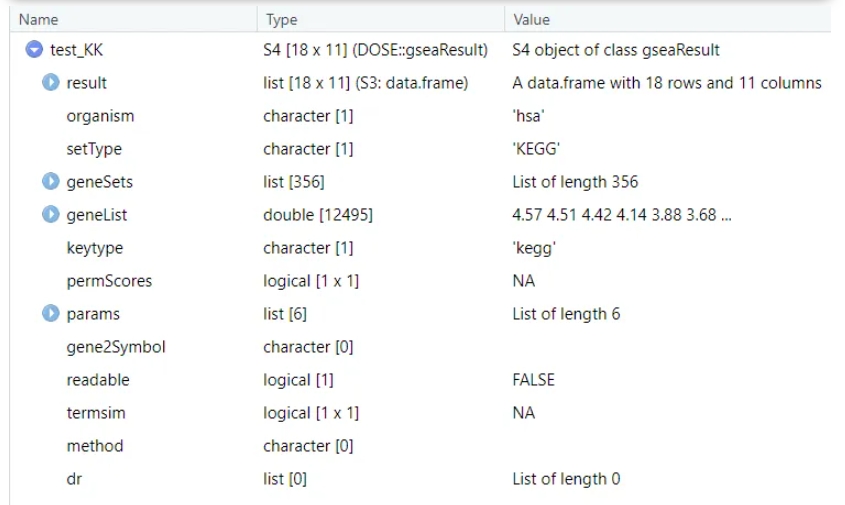
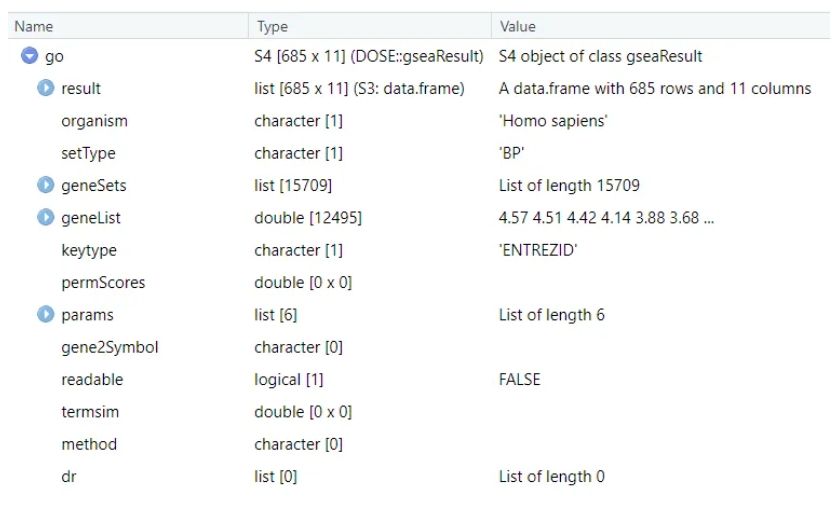
dfGO2gseaResult can covert gseGO output data frame back into gseaResult object, first we check the structures of gseaResult object:
Besides you need a annotation object:
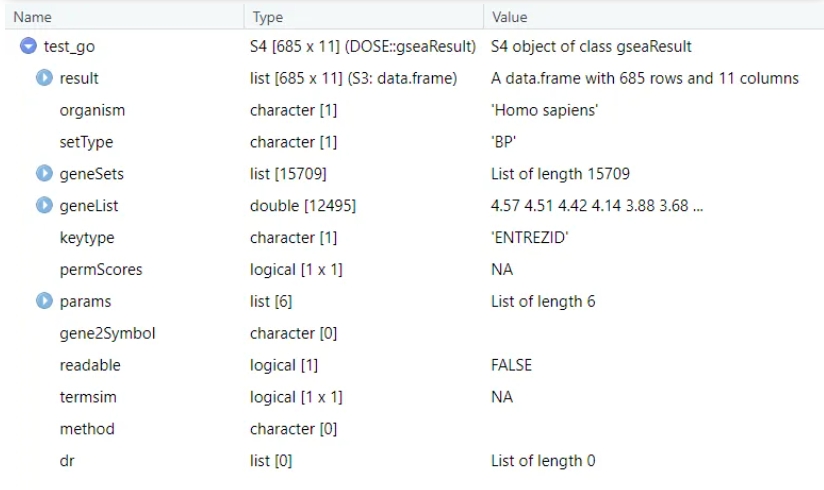
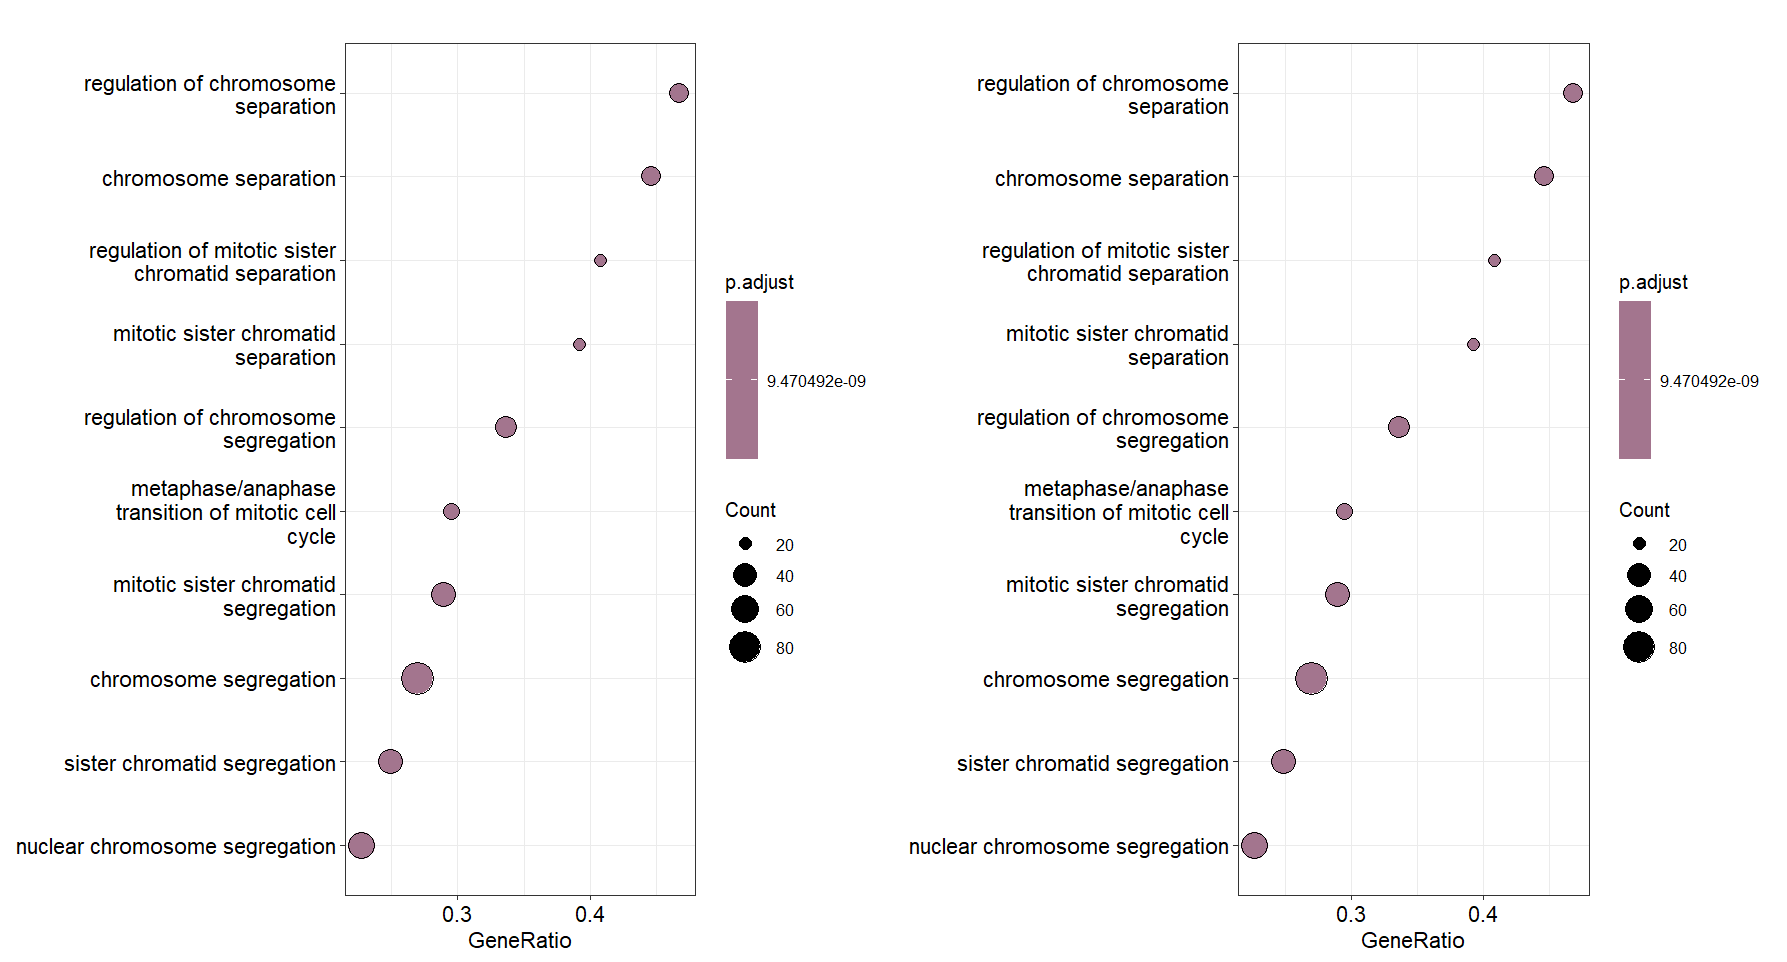
Let’s make a comparison:
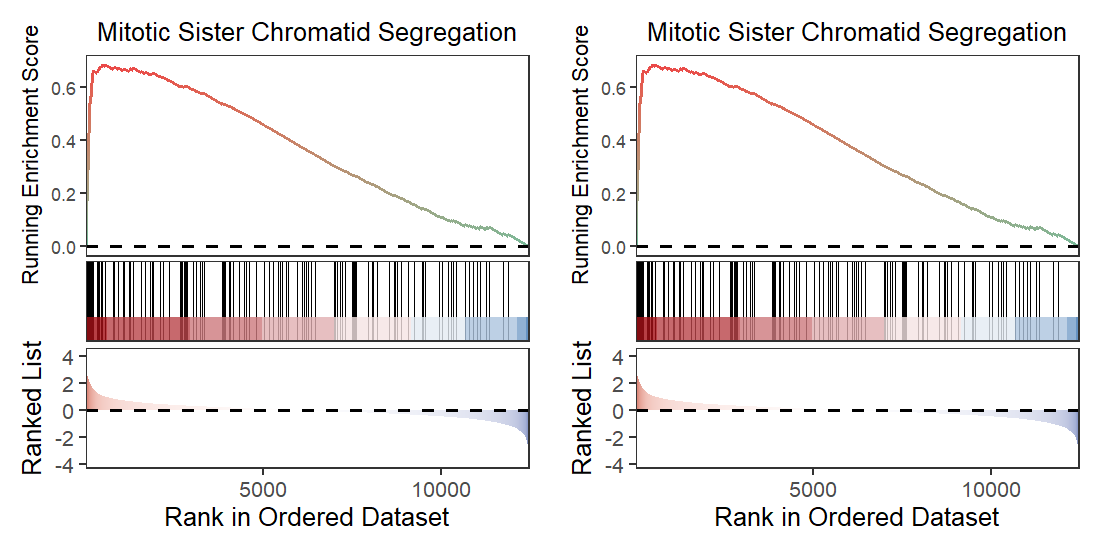
Comparison for gsea plot:
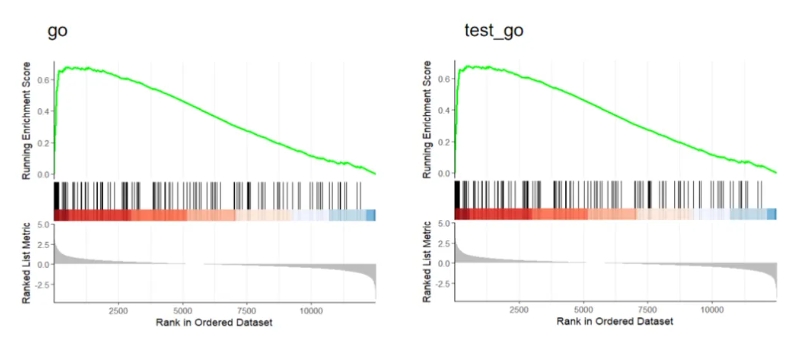
GseaVis:
praw <- gseaNb(object = go,geneSetID = "GO:0000070")
pnew <- gseaNb(object = test_go,geneSetID = "GO:0000070")

plot_grid(praw,pnew)