Chapter 7 Compare term on multiple conditions
Sometimes we want to compare a term changes on multiple different conditions. Here we supply a method a function to achieve this goal.
reference title: p53 Mediates Vast Gene Expression Changes That Contribute to Poor Chemotherapeutic Response in a Mouse Model of Breast Cancer
First suppose we have three log2FoldChange gene lists for multiple condition comparsion:
library(clusterProfiler)
library(org.Hs.eg.db)
library(GseaVis)

data(geneList, package="DOSE")

geneList1 <- sort(sample(seq(-2,2,by = 0.01),12495,replace = T),decreasing = T)
names(geneList1) <- sample(names(geneList),12495,replace = F)

geneList2 <- sort(sample(seq(-2,2,by = 0.01),12495,replace = T),decreasing = T)
names(geneList2) <- sample(names(geneList),12495,replace = F)


all_glist <- list(geneList,geneList1,geneList2)
Then we do enrichment analysis for each gene lists, here we need set pvalueCutoff = 1 to make sure most terms can be found for each enrichment results:
# loop to enrich
lapply(1:3, function(x){
  ego3 <- gseGO(geneList     = all_glist[[x]],
                OrgDb        = org.Hs.eg.db,
                ont          = "BP",
                minGSSize    = 100,
                maxGSSize    = 500,
                pvalueCutoff = 1,
                verbose      = FALSE)
}) -> m_gsea_list

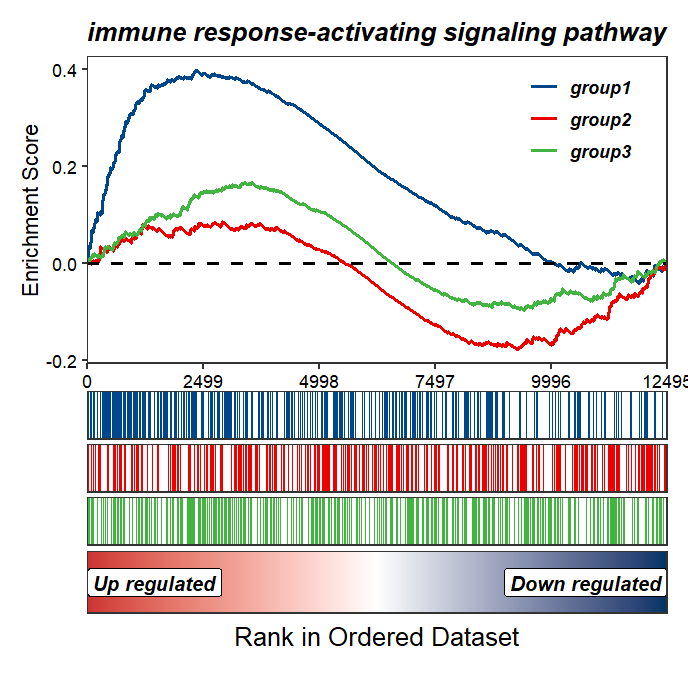
Then we can use GSEAmultiGP to visualize:
# plot
GSEAmultiGP(gsea_list = m_gsea_list,
            geneSetID = "GO:0002757",
            exp_name = c("group1","group2","group3"))
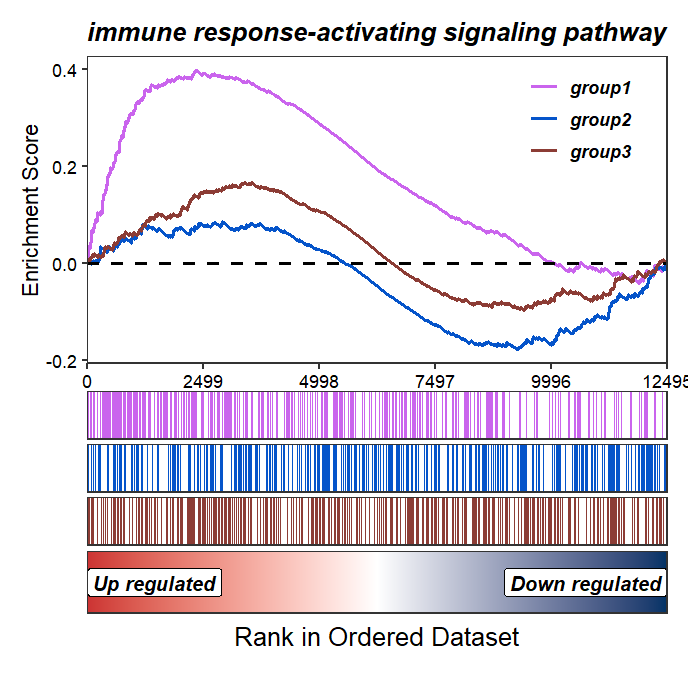
Change the colors:
GSEAmultiGP(gsea_list = m_gsea_list,
            geneSetID = "GO:0002757",
            exp_name = c("group1","group2","group3"),
            curve.col = ggsci::pal_lancet()(3))
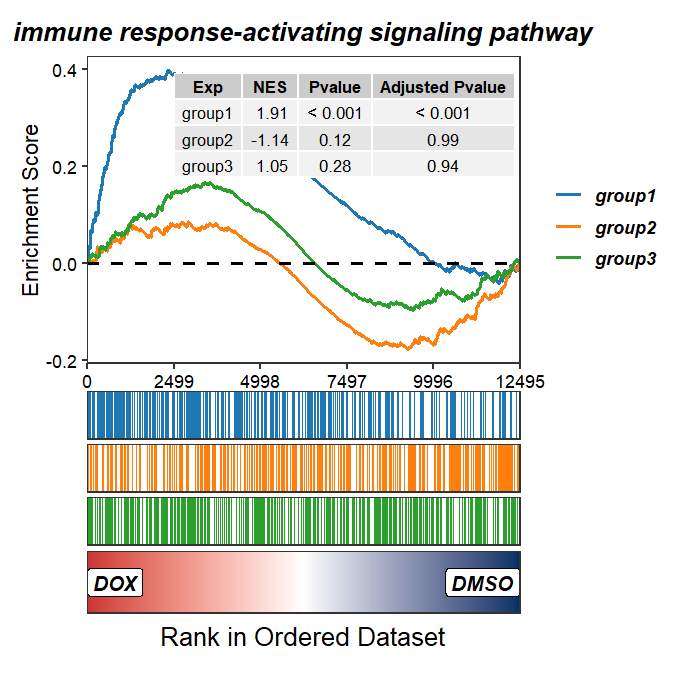
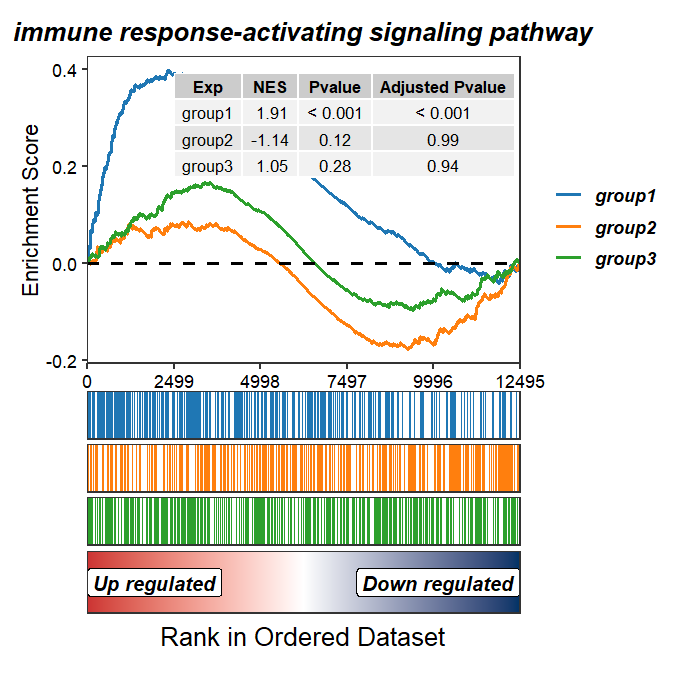
Add NES and pvalue:
GSEAmultiGP(gsea_list = m_gsea_list,
            geneSetID = "GO:0002757",
            exp_name = c("group1","group2","group3"),
            curve.col = ggsci::pal_d3()(3),
            addPval = T,
            pvalX = 0.99,pvalY = 0.99,
            legend.position = "right")
Change the bottom label:
GSEAmultiGP(gsea_list = m_gsea_list,
            geneSetID = "GO:0002757",
            exp_name = c("group1","group2","group3"),
            curve.col = ggsci::pal_d3()(3),
            addPval = T,
            pvalX = 0.99,pvalY = 0.99,
            legend.position = "right",
            rect.bm.label = c("DOX","DMSO"))