volcanoGsea
volcanoGsea can be used to show GSEA results with volcalno plot.
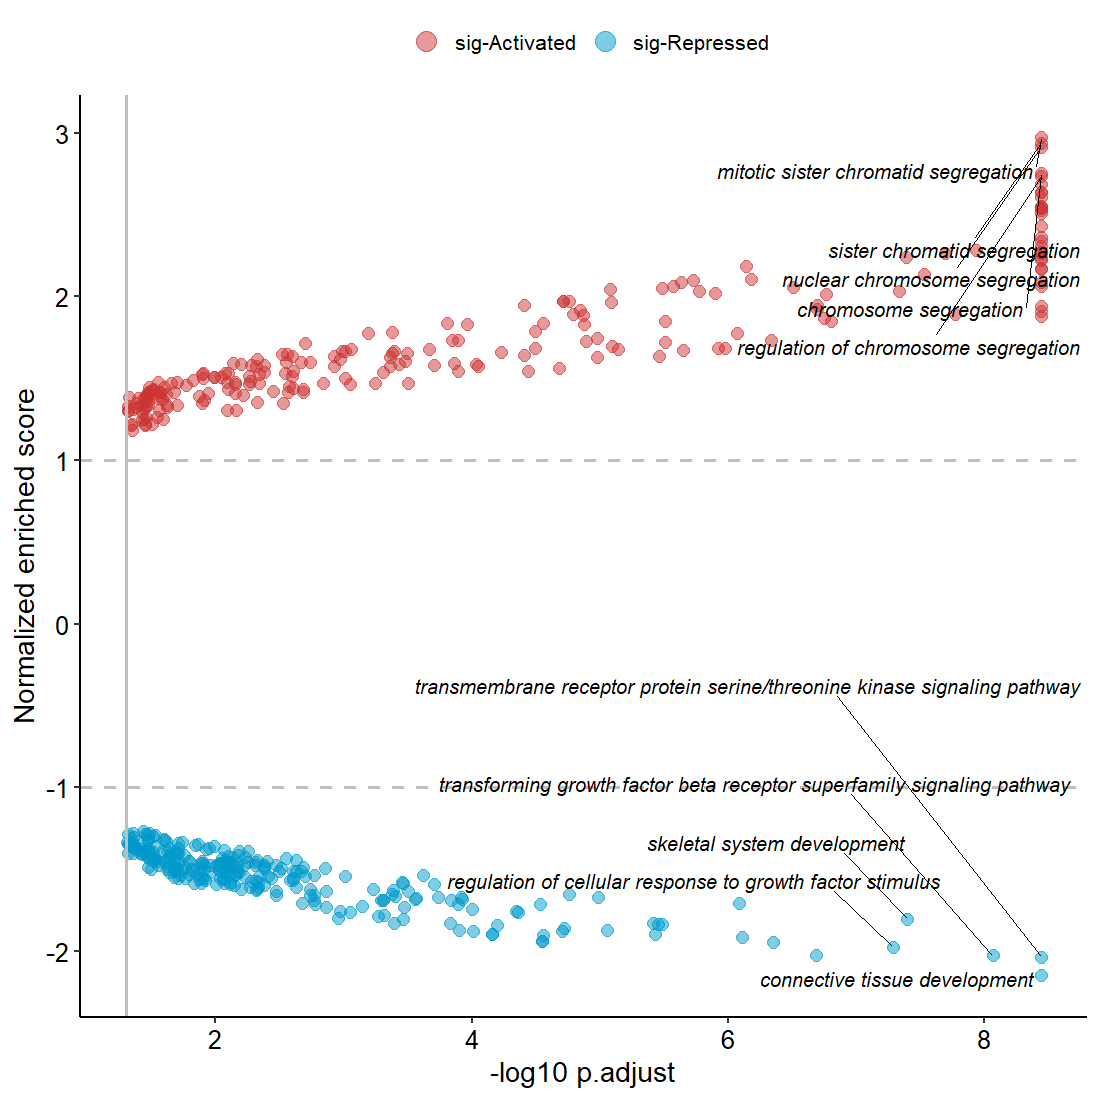
# plot
volcanoGsea(data = ego3)
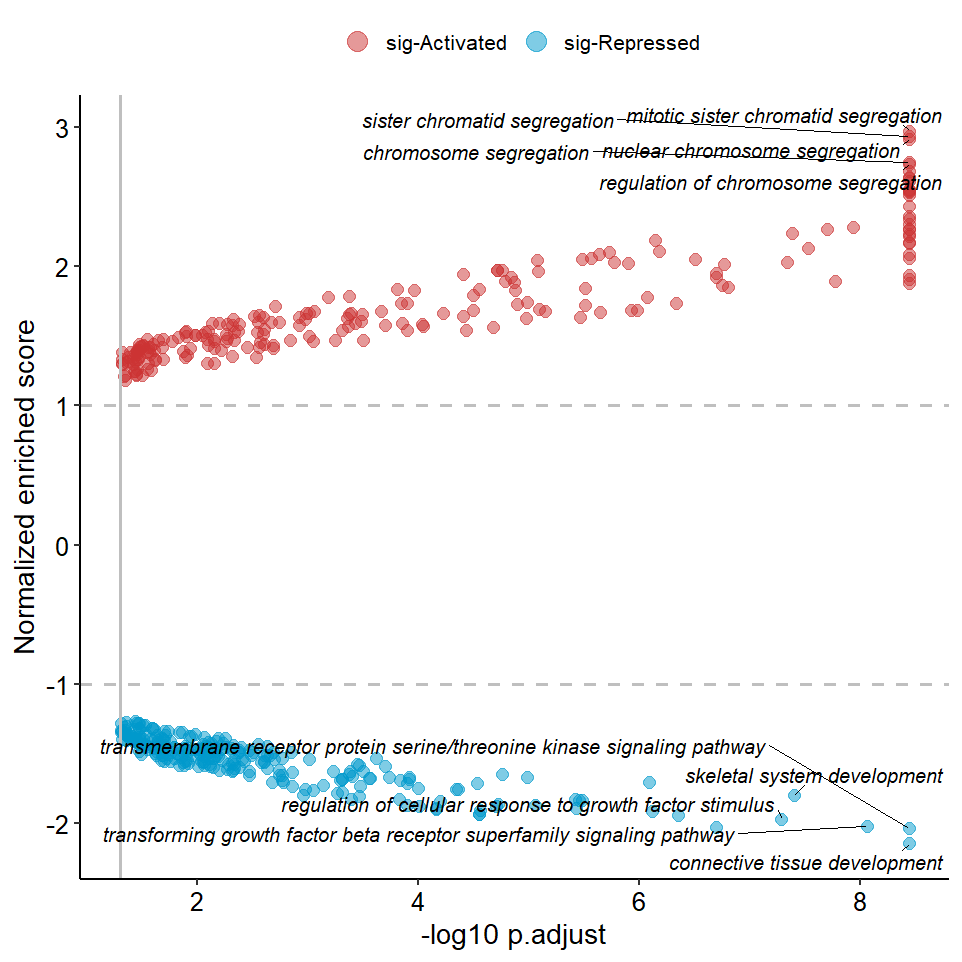
Adjust label:
volcanoGsea(data = ego3,nudge.y = c(-0.8,0.8))
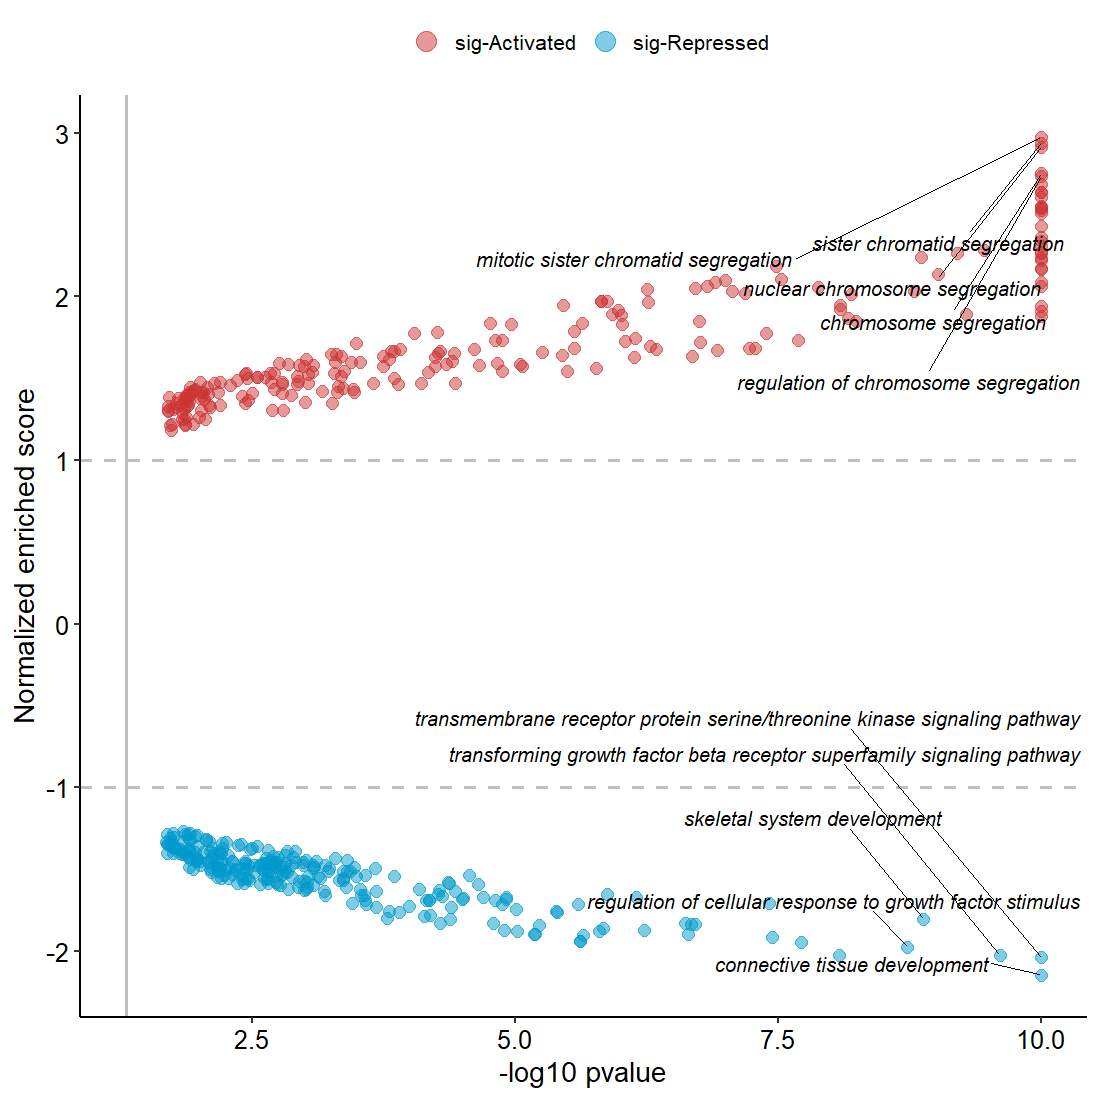
Use pvalue.cutoff:
volcanoGsea(data = ego3,
            pvalue.cutoff = 0.05,
            nudge.y = c(-0.8,0.8))
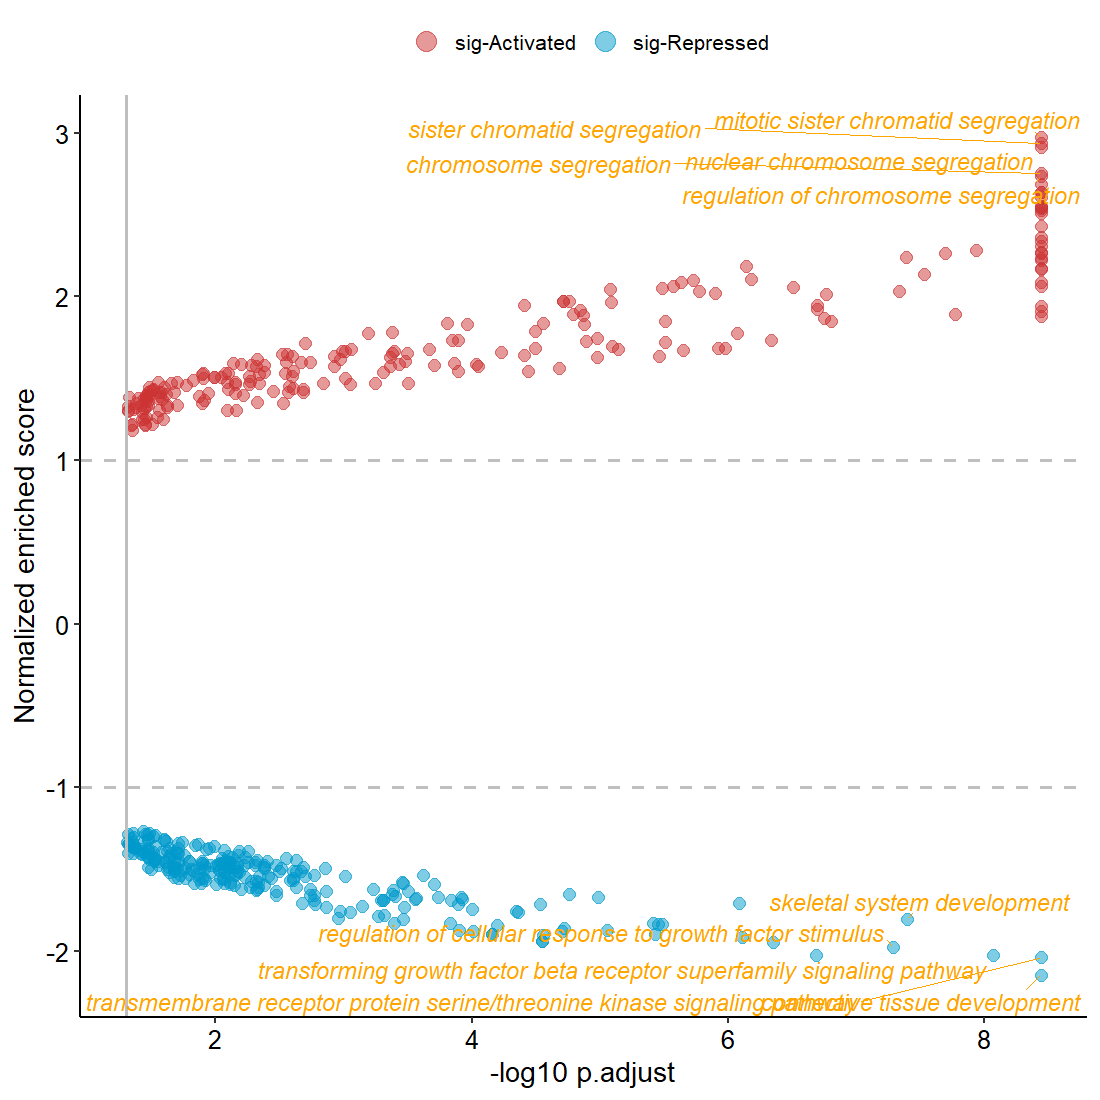
Change label color:
volcanoGsea(data = ego3,size = 4.5,color = 'orange')