# ribosome occupancy distance to specific motif
relmotif <- relative_motif_occupancy(object = obj0,
                                     cds_fa = "sac_cds.fa",
                                     do_offset_correct = T,
                                     motif_pattern = c("PP","PPP"))

# check
head(relmotif)
# # A tibble: 6 × 5
#   sample       motif  dist  value avg_val
#   <chr>        <chr> <dbl>  <dbl>   <dbl>
# 1 sgeIF5A-rep1 PP      -50  5873.   0.844
# 2 sgeIF5A-rep1 PP      -49  5134.   0.738
# 3 sgeIF5A-rep1 PP      -48 10371.   1.49
# 4 sgeIF5A-rep1 PP      -47  5329.   0.766
# 5 sgeIF5A-rep1 PP      -46  5607.   0.806
# 6 sgeIF5A-rep1 PP -45 12169. 1.75 Motif centered analysis
Intro
In our previous analysis, we identified significant ribosome pausing at motifs enriched in proline residues following eIF5A depletion. These stalling events were especially prominent at polyproline stretches, consistent with the known role of eIF5A in facilitating translation elongation at such sites.
To further support and visualize these findings, we can perform a motif-centered ribosome occupancy analysis. This approach involves aligning ribosome footprint data around specific amino acid motifs and measuring the average occupancy within a defined window upstream and downstream of each motif. By focusing on ribosomes positioned near motifs of interest—such as known stalling sequences identified in eIF5Ad cells—we can generate metagene-like plots that highlight the local translation dynamics.
For example, by centering ribosome profiles around high-scoring pause motifs (e.g., PPP, PPG, PXD), we can observe localized peaks in ribosome density. Notably, in the absence of eIF5A, we often detect an additional accumulation of ribosomes ~30 nucleotides upstream of pause sites, indicative of ribosome queuing behind stalled complexes. These occupancy patterns provide detailed insights into how specific sequence contexts contribute to translational bottlenecks in eIF5A-deficient cells.
This motif-centered analysis complements global pause score comparisons by offering a high-resolution view of ribosome behavior near individual stalling elements, helping to clarify the mechanistic impact of eIF5A depletion on translation elongation efficiency.
Motif centered analysis
To quantitatively assess ribosome pausing around specific sequence motifs, we apply the relative_motif_occupancy function. This function computes the average ribosome occupancy at defined distances upstream and downstream of user-specified amino acid motifs across coding sequences.
For example, in the following code, we analyze ribosome occupancy profiles centered around proline-rich motifs such as “PP” and “PPP”. These motifs are known to induce translation pausing, particularly under eIF5A-depleted conditions:
The relative_motif_plot function is used to visualize the data generated by the relative_motif_occupancy analysis:
relative_motif_plot(relmotif)
The motif_pattern parameter allows the inclusion of multiple distinct motifs for an integrated ribosome occupancy analysis. This is particularly useful for evaluating the translational effect of various sequence contexts beyond polyproline motifs.
For instance, in the study, several high-pause tripeptide motifs identified under eIF5A depletion conditions do not contain consecutive prolines (i.e., non-Pro-Pro motifs). These motifs can be collectively analyzed using the relative_motif_occupancy function as shown below:
# Calculate ribosome occupancy relative to a set of non-Pro-Pro pausing motifs
relmotif2 <- relative_motif_occupancy(object = obj0,
                                      cds_fa = "sac_cds.fa",
                                      do_offset_correct = TRUE,
                                      motif_pattern = c("DDP", "FDR", "PDP", "DPG", "DNP",
                                                        "RDK", "DGP", "PDA", "PDK", "PDV",
                                                        "PDG", "DVG", "GDP", "DDG", "PDI",
                                                        "GGT", "PGP", "DSP"))

# Plot average ribosome occupancy relative to motif position
relative_motif_plot(relmotif2)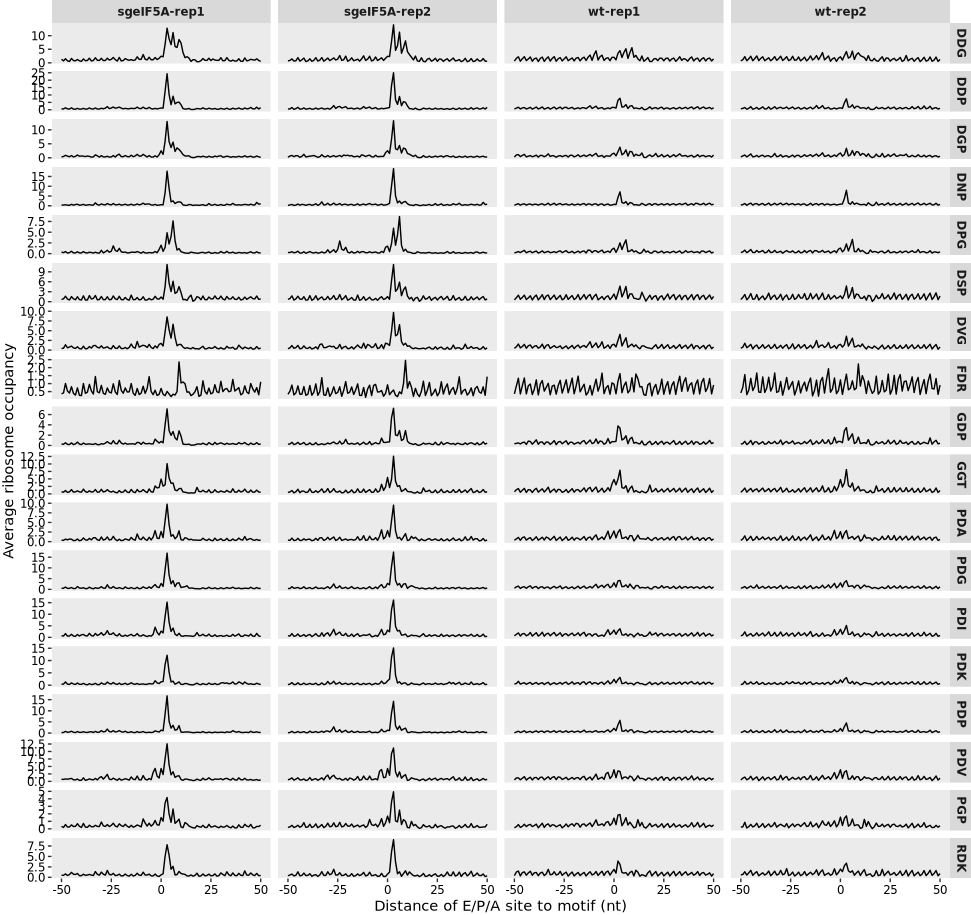
To provide a more consolidated view of ribosome occupancy around a collection of stalling motifs, we aggregate the data across multiple motifs and summarize it collectively, enabling clearer visualization of ribosome pausing trends:
# group by motifs
relmotif2.cm <- relmotif2 %>%
  dplyr::mutate(motif = "Non-Pro-Pro") %>%
  dplyr::group_by(sample,motif,dist) %>%
  dplyr::summarise(mn = mean(avg_val))

# plot
ggplot(relmotif2.cm) +
  geom_path(aes(x = dist,y = mn)) +
  facet_grid(motif~sample,scales = "free_y") +
  theme(panel.grid = element_blank(),
        strip.text = element_text(face = "bold"),
        axis.text = element_text(colour = "black")) +
  xlab("Distance of P site to motif") +
  ylab("Average ribosome occupancy")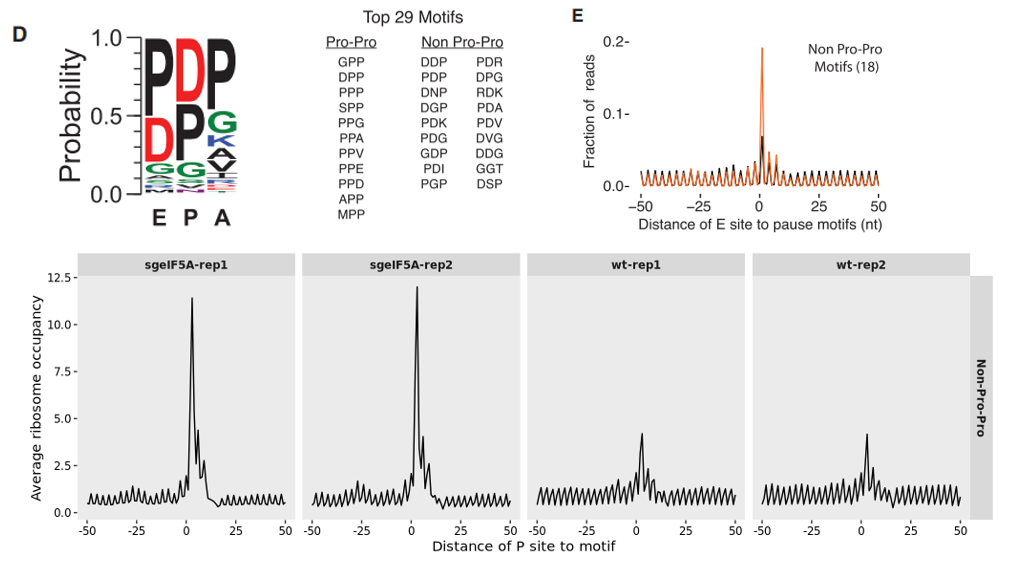
Centered codon analysis
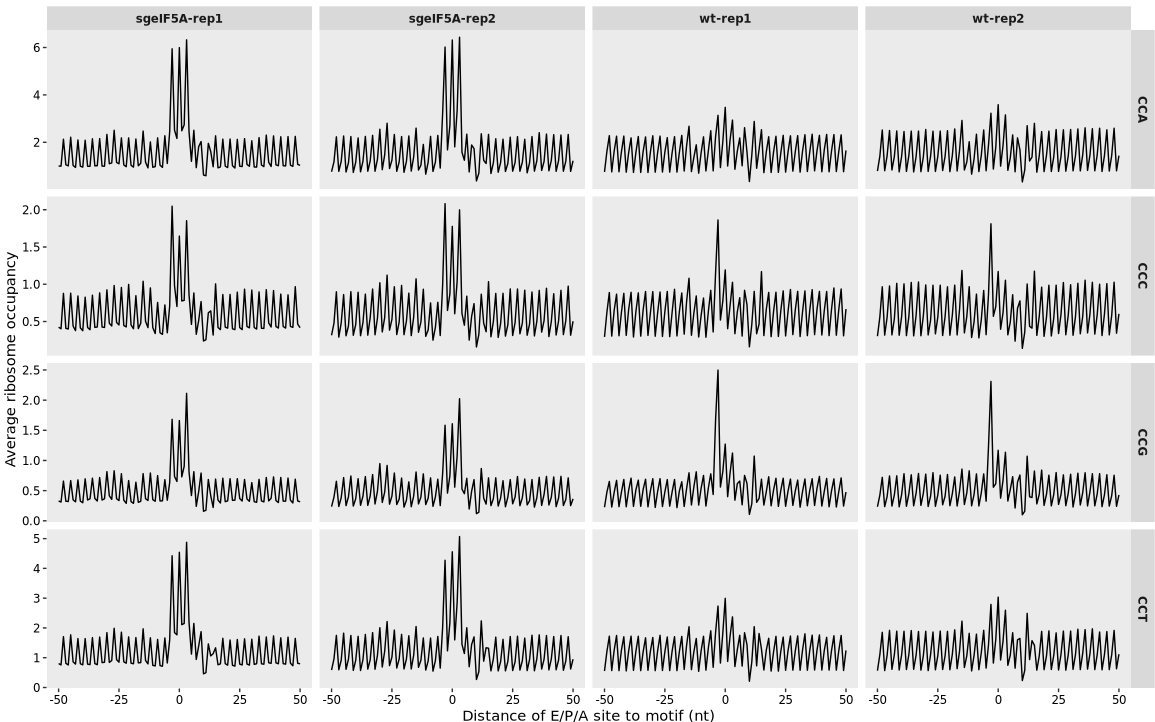
Beyond amino acid motif analysis, ribosome occupancy can also be studied at the codon level. This approach helps reveal whether specific codons, such as those encoding Proline, are associated with ribosome pausing.
For example, here we analyze ribosome occupancy around the four Pro codons (CCT, CCC, CCA, CCG):
# Perform codon-centered ribosome occupancy analysis on proline codons
relmotif3 <- relative_motif_occupancy(object = obj0,
                                      cds_fa = "sac_cds.fa",
                                      do_offset_correct = TRUE,
                                      search_type = "codon",
                                      motif_pattern = c("CCT", "CCC", "CCA", "CCG"))

# Plot ribosome occupancy surrounding individual Pro codons
relative_motif_plot(relmotif3)