obj0 <- get_occupancy(object = obj0,
                      gene_name = "THO1",
                      coordinate_to_trans = T,
                      do_reads_offset = T)

head(obj0@ribo_occupancy)
# # A tibble: 6 × 6
#   sample  rname               pos count    rpm smooth
#   <chr>   <chr>             <dbl> <int>  <dbl>  <dbl>
# 1 wt-rep1 YER063W_mRNA|THO1    20     2 0.0452 0.0452
# 2 wt-rep1 YER063W_mRNA|THO1    22     3 0.0679 0.0679
# 3 wt-rep1 YER063W_mRNA|THO1    27     1 0.0226 0.0226
# 4 wt-rep1 YER063W_mRNA|THO1    28     1 0.0226 0.0226
# 5 wt-rep1 YER063W_mRNA|THO1    29     1 0.0226 0.0226
# 6 wt-rep1 YER063W_mRNA|THO1 41 1 0.0226 0.0226Track plot
Intro
In ribo-seq analysis, it is often necessary to visualize the ribosomal occupancy over specific genes to understand their translational dynamics. The package riboTransVis facilitates this by allowing rapid, gene-specific extraction of reads directly from BAM files. Instead of loading and filtering the entire BAM file, riboTransVis searches for target gene-associated reads and performs post-processing just on those, resulting in significantly faster plotting and reduced memory usage.
When working with BAM files aligned to the genome, the get_occupancy function includes a coordinate_to_trans = TRUE option. This converts genomic coordinates into transcriptomic coordinates, enabling users to easily inspect read distributions along full-length transcripts. For BAM files aligned against transcriptome sequences, this conversion is unnecessary.
Furthermore, the function provides a useful do_reads_offset parameter that adjusts P-site offsets to more accurately reflect ribosomal E/P/A site occupancy distributions.
Visualizing Transcriptomic Read Density Tracks
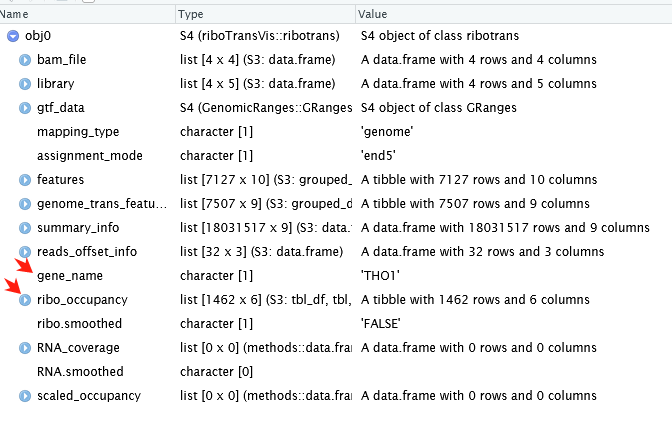
When the get_occupancy function is called with the gene_name argument, the ribotrans object stores the gene-specific ribosome occupancy data in its ribo_occupancy slot. Below is an example using the gene THO1, as reported in the literature:
See ribotrans object structure:
After extracting the ribosome occupancy data, use the trans_plot function for visualization:
trans_plot(object = obj0, type = "ribo")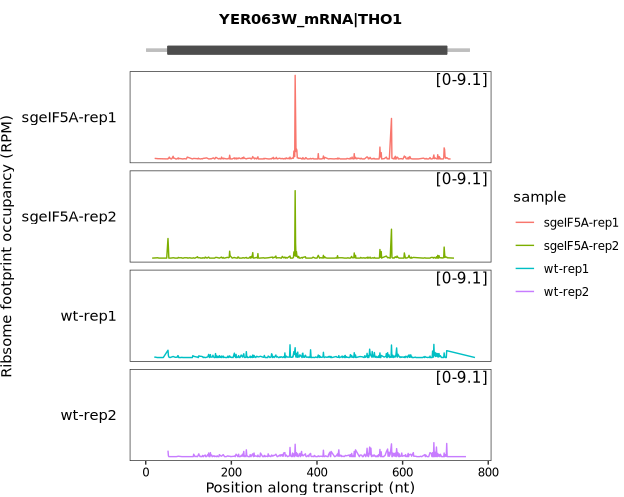
Set the layer parameter to choose different plotting styles: “line” corresponds to the geom_path layer, while “col” corresponds to the geom_col layer.
trans_plot(object = obj0, type = "ribo",layer = "col")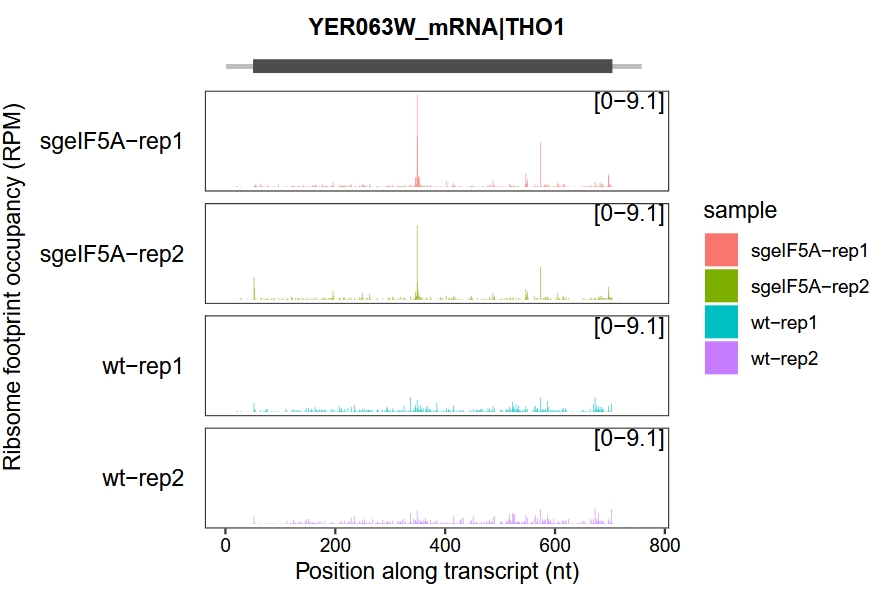
Setting new_signal_range allows the display of a conventional y-axis scale:
trans_plot(object = obj0, type = "ribo",
           new_signal_range = F)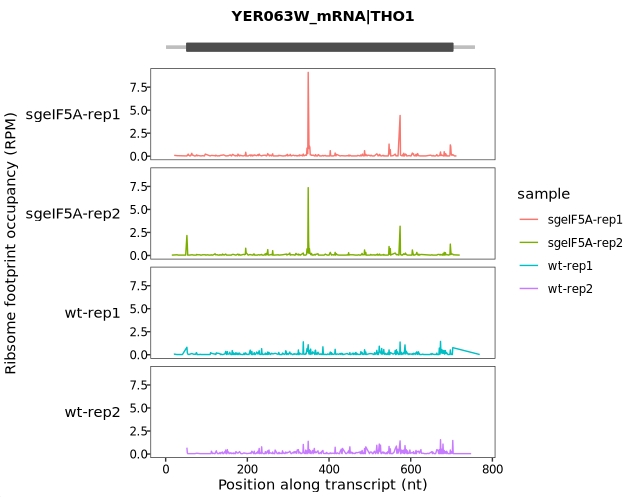
Visualizing Genomic Read Density Tracks
In addition to visualizing ribosome occupancy across genes in transcriptomic coordinates, users may sometimes need to view occupancy data in the context of genomic coordinates. This can be particularly useful for aligning ribosome profiling data with genomic features such as introns, intergenic regions, or regulatory elements. The riboTransVis package supports visualization directly in the genomic coordinate system, providing greater flexibility for diverse analysis needs.
When your upstream aligned BAM files are mapped to the genome reference rather than the transcriptome, you can retain the original genomic coordinates during the occupancy extraction step. To do this, simply set the parameter coordinate_to_trans = FALSE in the get_occupancy function. This disables the transcript coordinate transformation process, allowing visualizations to reflect the original genome-based alignment information:
obj0 <- get_occupancy(object = obj0,
                      gene_name = "THO1",
                      coordinate_to_trans = F,
                      do_reads_offset = T)

head(obj0@ribo_occupancy)
# # A tibble: 6 × 6
#   sample  rname    pos count    rpm smooth
#   <chr>   <fct>  <dbl> <int>  <dbl>  <dbl>
# 1 wt-rep1 V     281679     2 0.0452 0.0452
# 2 wt-rep1 V     281681     3 0.0679 0.0679
# 3 wt-rep1 V     281686     1 0.0226 0.0226
# 4 wt-rep1 V     281687     1 0.0226 0.0226
# 5 wt-rep1 V     281688     1 0.0226 0.0226
# 6 wt-rep1 V     281700     1 0.0226 0.0226
At this point, to visualize ribosome occupancy data mapped in genomic coordinates, we need to use the genome_trans_plot function instead of trans_plot. Unlike trans_plot, which is designed for transcriptomic coordinate systems, genome_trans_plot allows users to generate read density tracks directly based on the original genomic positions:
genome_trans_plot(object = obj0, type = "ribo")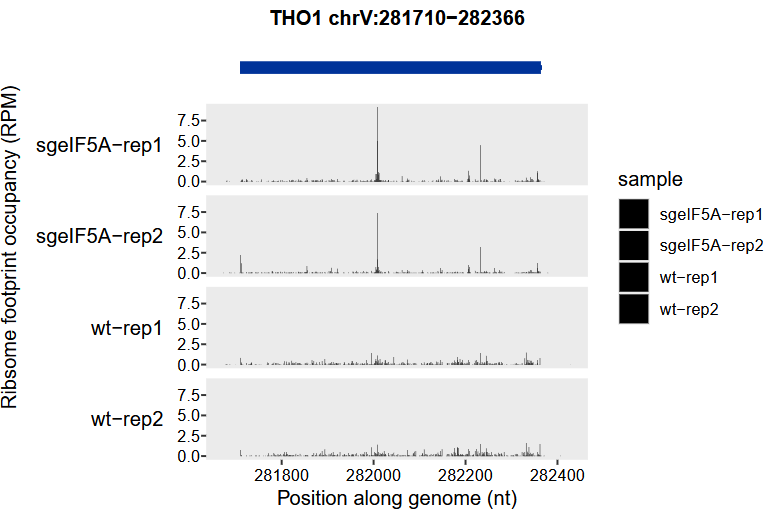
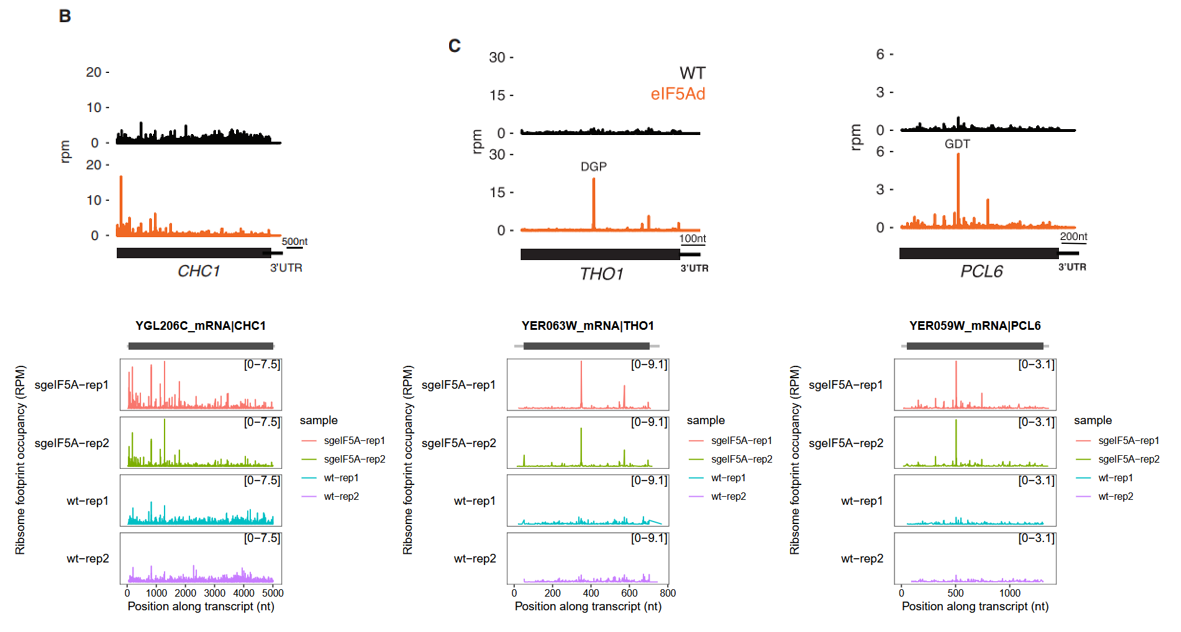
Examples in literature
We now demonstrate how to generate track plots for three genes commonly referenced in the literature: CHC1, THO1, and PCL6:
More example see DENR promotes translation reinitiation chapter.