feature_plot(obj0)7 Feature distribution
7.1 Read distribution across transcript regions
Ribosome-protected fragments (RPFs) are predominantly derived from coding sequence (CDS) regions, as ribosomes actively translate these parts of the mRNA. Consequently, high-quality Ribo-seq data should show a strong enrichment of reads mapping to CDS regions, with relatively fewer reads aligning to untranslated regions (5′UTR and 3′UTR).
Analyzing the proportion of reads mapping to CDS versus 5′UTR and 3′UTR provides an important metric for assessing Ribo-seq data quality.
High CDS enrichment indicates efficient ribosome footprint capture and proper rRNA/tRNA depletion.
Excessive 5′UTR or 3′UTR mapping may suggest contamination from non-translating RNA fragments or suboptimal library preparation.
A typical high-quality Ribo-seq dataset has >70–80% of reads mapping within annotated CDS regions under standard conditions.
7.2 Feature plot
The feature_plot() function can be used to analyze and visualize the distribution of aligned reads across different transcript features, including the coding sequence (CDS), 5′ untranslated region (5′UTR), and 3′ untranslated region (3′UTR):
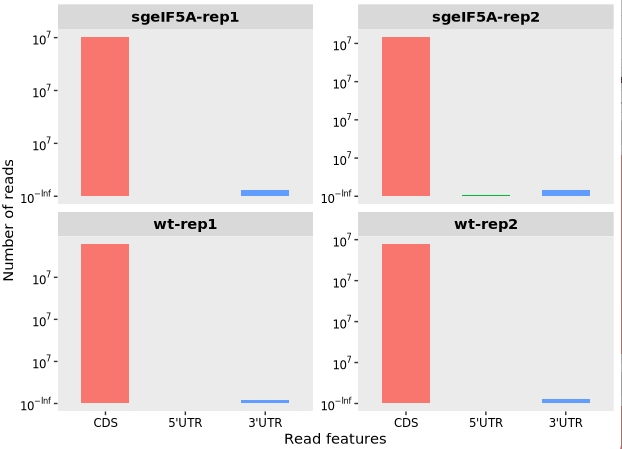
This plot helps assess the quality of Ribo-seq data by showing the relative proportion of reads mapping to each region. High-quality datasets typically show strong enrichment in CDS regions, as ribosome-protected fragments originate mainly from translated coding regions.
A high percentage of reads in UTRs may indicate contamination or non-specific signals.