library(clusterProfiler)
library(org.Hs.eg.db)

en <- enrich_analysis(diff_data = te.rex$deg_anno,
                      log2fc_col = "log2FoldChange",
                      pval_col = "pvalue",
                      type = "go",
                      trend = "up",
                      ont = "BP",
                      organism = "hsa",
OrgDb = org.Hs.eg.db)Pathway enrichment analysis
Intro
In the previous section, we introduced how to quantify RNA, extract normalized data, and perform differential analysis. We also discussed which pathways might be associated with up- and down-regulated genes. In this section, we demonstrate how to conduct pathway enrichment analysis on the differentially expressed genes identified.
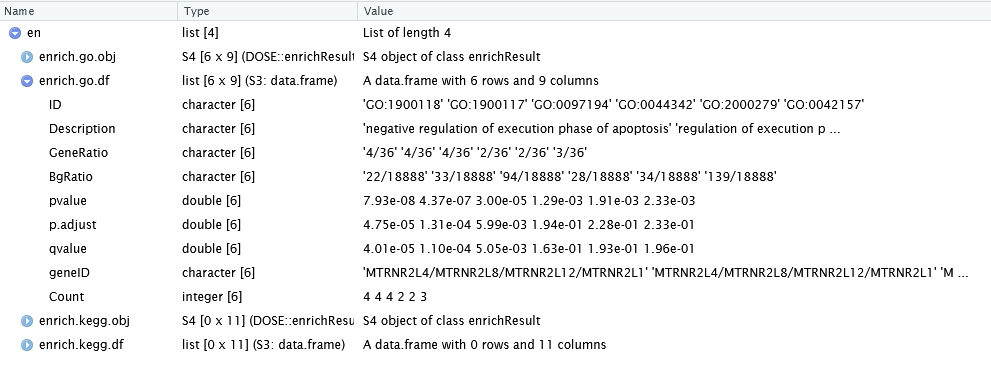
Go enrichment analysis
The enrich_analysis function can be applied to the differential analysis results obtained previously. It utilizes the clusterProfiler package to carry out pathway enrichment and returns a list containing both the GO and KEGG enrichment objects as well as corresponding tables.
For example, the following code snippet selects up-regulated genes for Biological Process (BP) pathway enrichment:
After obtaining the enrichment results, you can use the enrichplot package to produce various visualizations:
# dotplot
enrichplot::dotplot(en$enrich.go.obj)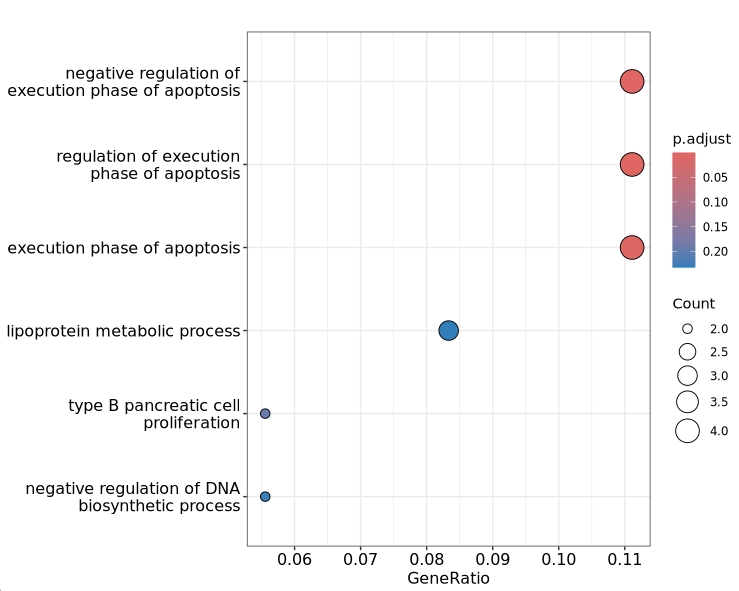
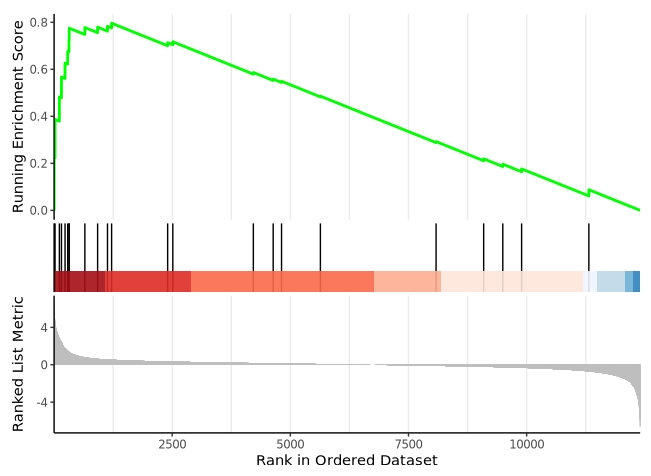
GSEA enrichment analysis
Specifying type = “gsea” includes all genes in the GSEA-based enrichment analysis:
en2 <- enrich_analysis(diff_data = te.rex$deg_anno,
                      log2fc_col = "log2FoldChange",
                      pval_col = "pvalue",
                      type = "gsea",
                      ont = "BP",
                      organism = "hsa",
                      OrgDb = org.Hs.eg.db)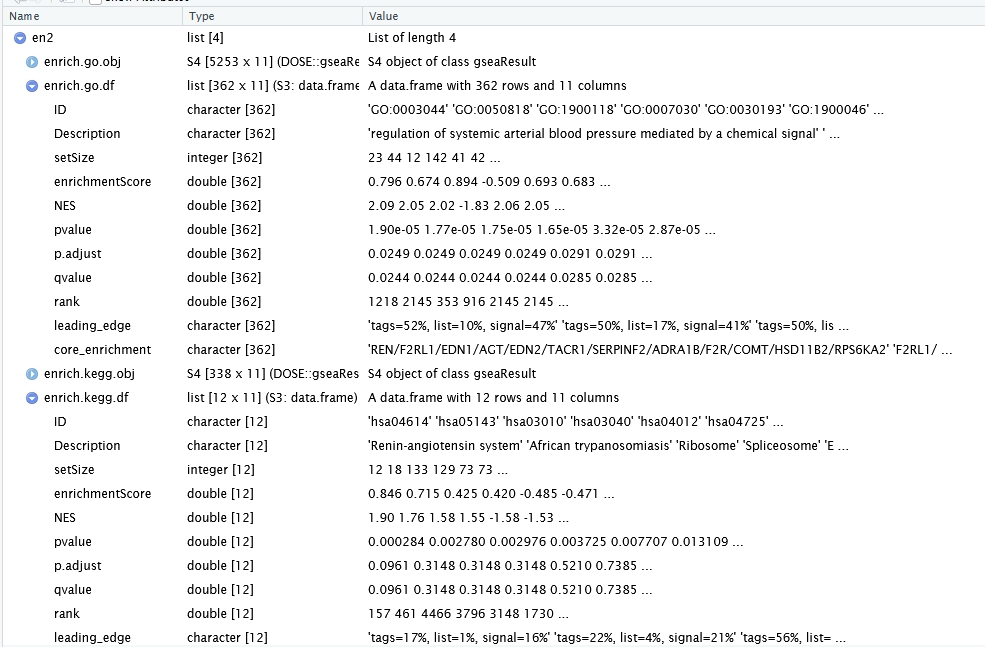
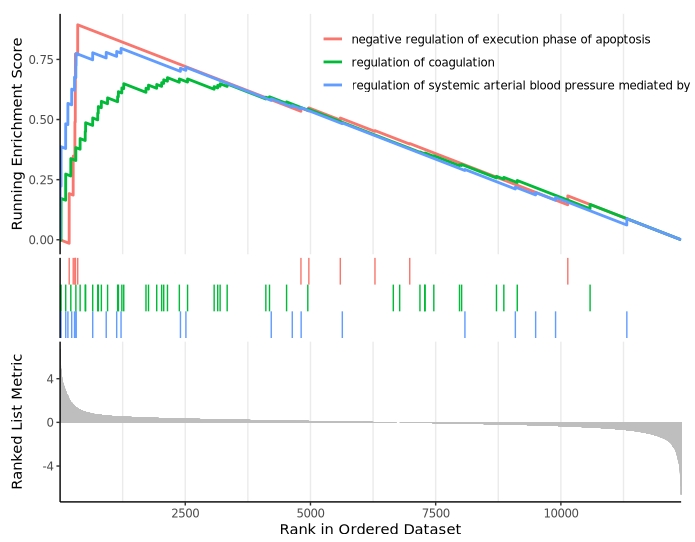
GSEA visualization:
Multiple pathway visualization: