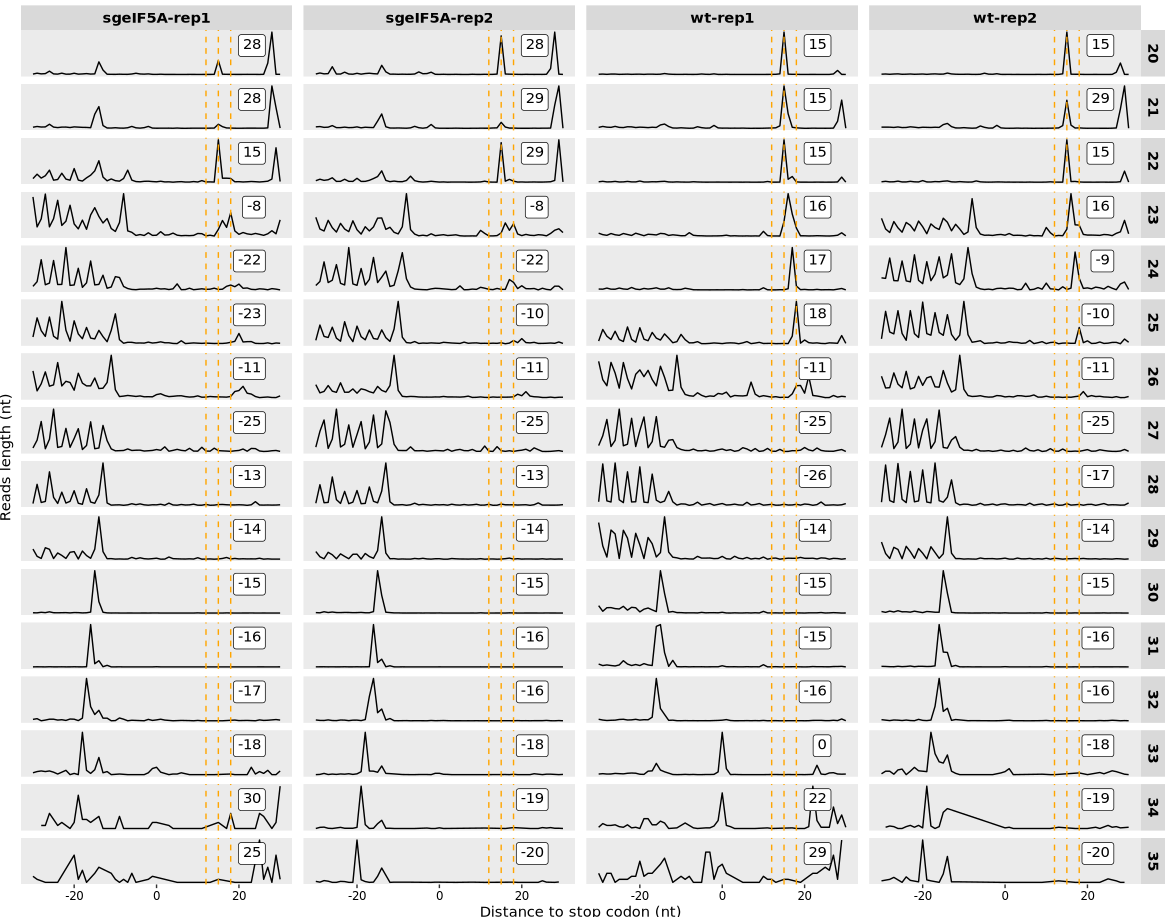
relative_offset_plot(obj0, type = "rel2stop")10 Offset check
10.1 Inferring offset
10.1.1 Motivation: Determining the P-site Offset
In ribosome profiling (Ribo-seq), precisely estimating the P-site position—the nucleotide on the mRNA where the ribosome’s peptidyl site is located—is critical for accurate analysis of translational dynamics. Because different read (fragment) lengths may result in different P-site offsets, it’s important to determine where each read length tends to accumulate relative to the translation start or stop site.
RPFs often peak at stereotypical distances (e.g., +12 nt downstream of the start codon), and these characteristic peak positions can be used to assign P-site offsets by read length.
The relative_offset_plot() function visualizes this behavior and helps determine P-site positioning across varying read lengths.
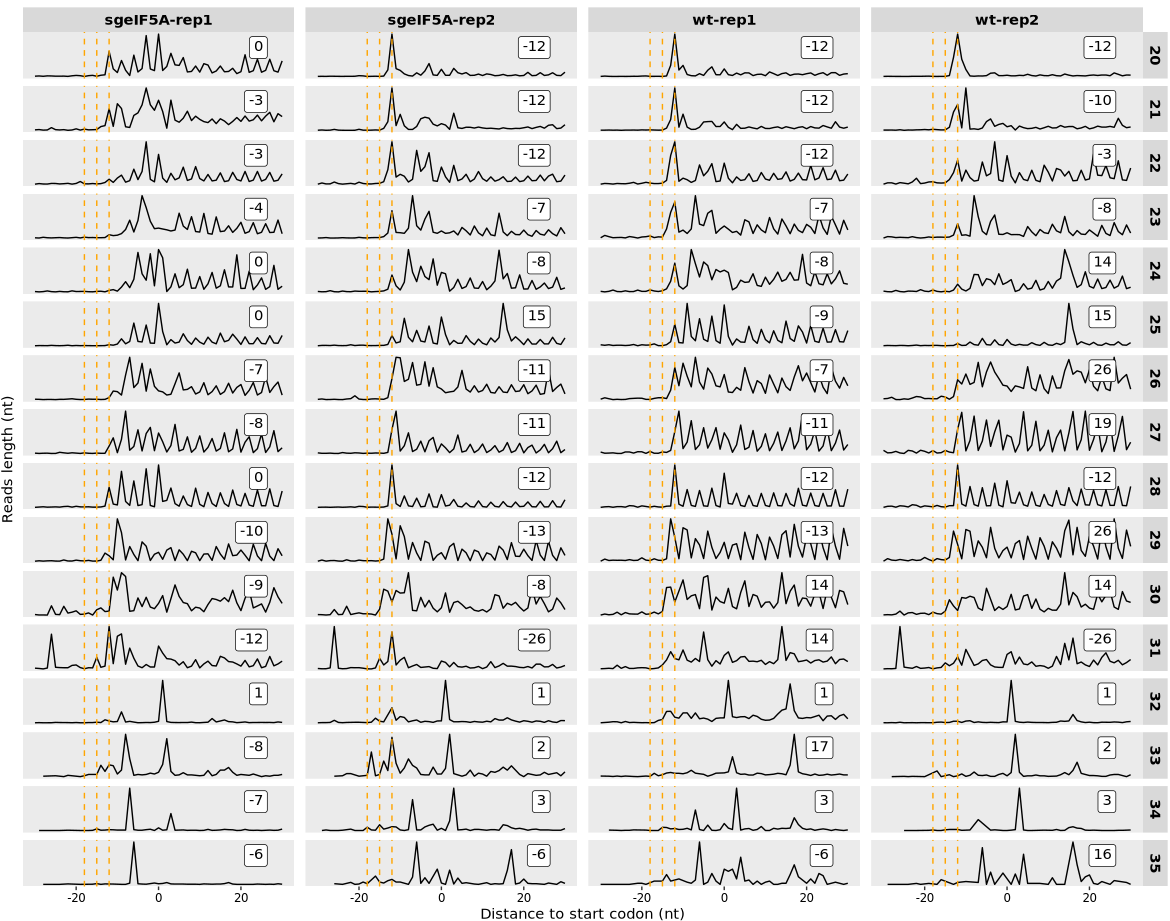
10.1.2 What does relative_offset_plot() Show?
This function generates a per-read-length line plot showing the distribution of RPF read counts centered around either:
The start codon (type = “rel2start”), or
The stop codon (type = “rel2stop”)
For each read length:
The X-axis marks the relative position from the codon (in nucleotides)
The Y-axis shows the read count at each position
A vertical dashed reference line is placed at common offsets (e.g., +12 nt), expected to align with the P-site
The position with maximum signal is automatically annotated as a suggested offset
This plot assists the user in manually or programmatically determining correct P-site offsets per read length.
10.1.3 Why it Matters
Accurate P-site offset assignment:
✅ Enables frame-level periodicity analysis
✅ Improves quantitative interpretation of translation initiation/elongation
✅ Is essential for detecting codon-level ribosome pausing or accumulation
10.1.4 Function usage
In the offset plot generated by relative_offset_plot(), the orange dashed vertical lines highlight positions upstream of the start codon at 12, 15, and 18 nucleotides—commonly observed P-site locations in high-quality Ribo-seq data. These serve as visual guides for interpreting where ribosome footprints (RPFs) tend to accumulate. Ideally, the correct P-site offset for each fragment length can be inferred from the peak position of read counts—i.e., the relative distance where the maximum signal occurs. However, the accuracy of offset identification strongly depends on data quality; in lower-quality or noisy samples, clear signal enrichment may be absent or ambiguous, making offset determination less reliable. In such cases, it is recommended to combine this visualization with other quality control metrics (e.g., frame-periodicity plots) or to use specialized tools such as riboWaltz, RiboCode, or RiboTISH for offset inference. These tools apply statistical or model-based approaches to improve the robustness and reproducibility of P-site calibration. Altogether, careful offset selection is critical for downstream analyses like codon-level profiling, pausing detection, and frame-specific translation quantification:
{ndefined{r,eval=FALSE} relative_offset_plot(obj0)
10.1.5 To check offset peaks near stop codon:
10.1.6 To extract offset positions
The plot can be used analytically, not just visually. Use return_offset = TRUE to extract peak positions per fragment size:
offset_table <- relative_offset_plot(obj0, return_offset = TRUE)