period_plot(object = obj)6 Periodicity check
6.1 Introduction
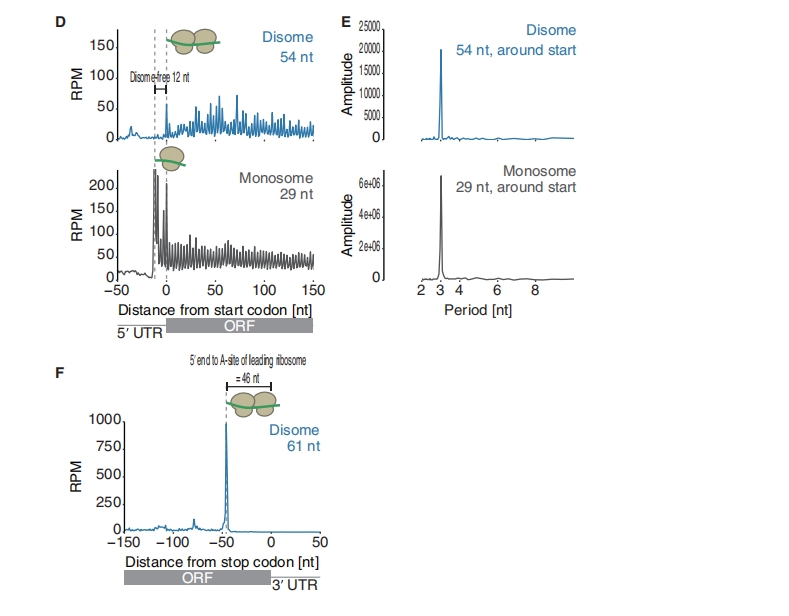
In addition to evaluating ribosome profiling (Ribo-seq) data periodicity by analyzing the distribution of reads across the three translational reading frames (frame 0, 1, 2), another powerful approach is to apply Discrete Fourier Transform (DFT) to directly assess periodic patterns in the data. This method can quantitatively capture the characteristic 3-nucleotide (3-nt) periodicity associated with actively translating ribosomes. A notable example of this approach is demonstrated in the Cell Reports article “Genome-wide Survey of Ribosome Collision” where DFT was used to investigate periodic features in ribosome footprint data.
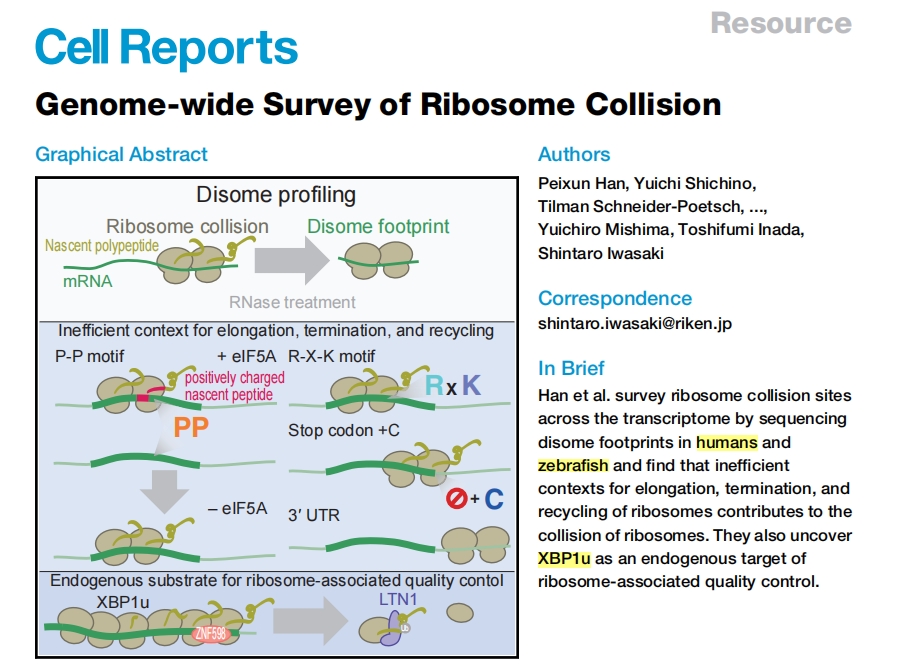
The figure below illustrates the detection of 3-nt periodicity using Discrete Fourier Transform (DFT) as presented in the article:
6.2 Discrete fourier transform for periodiciy check
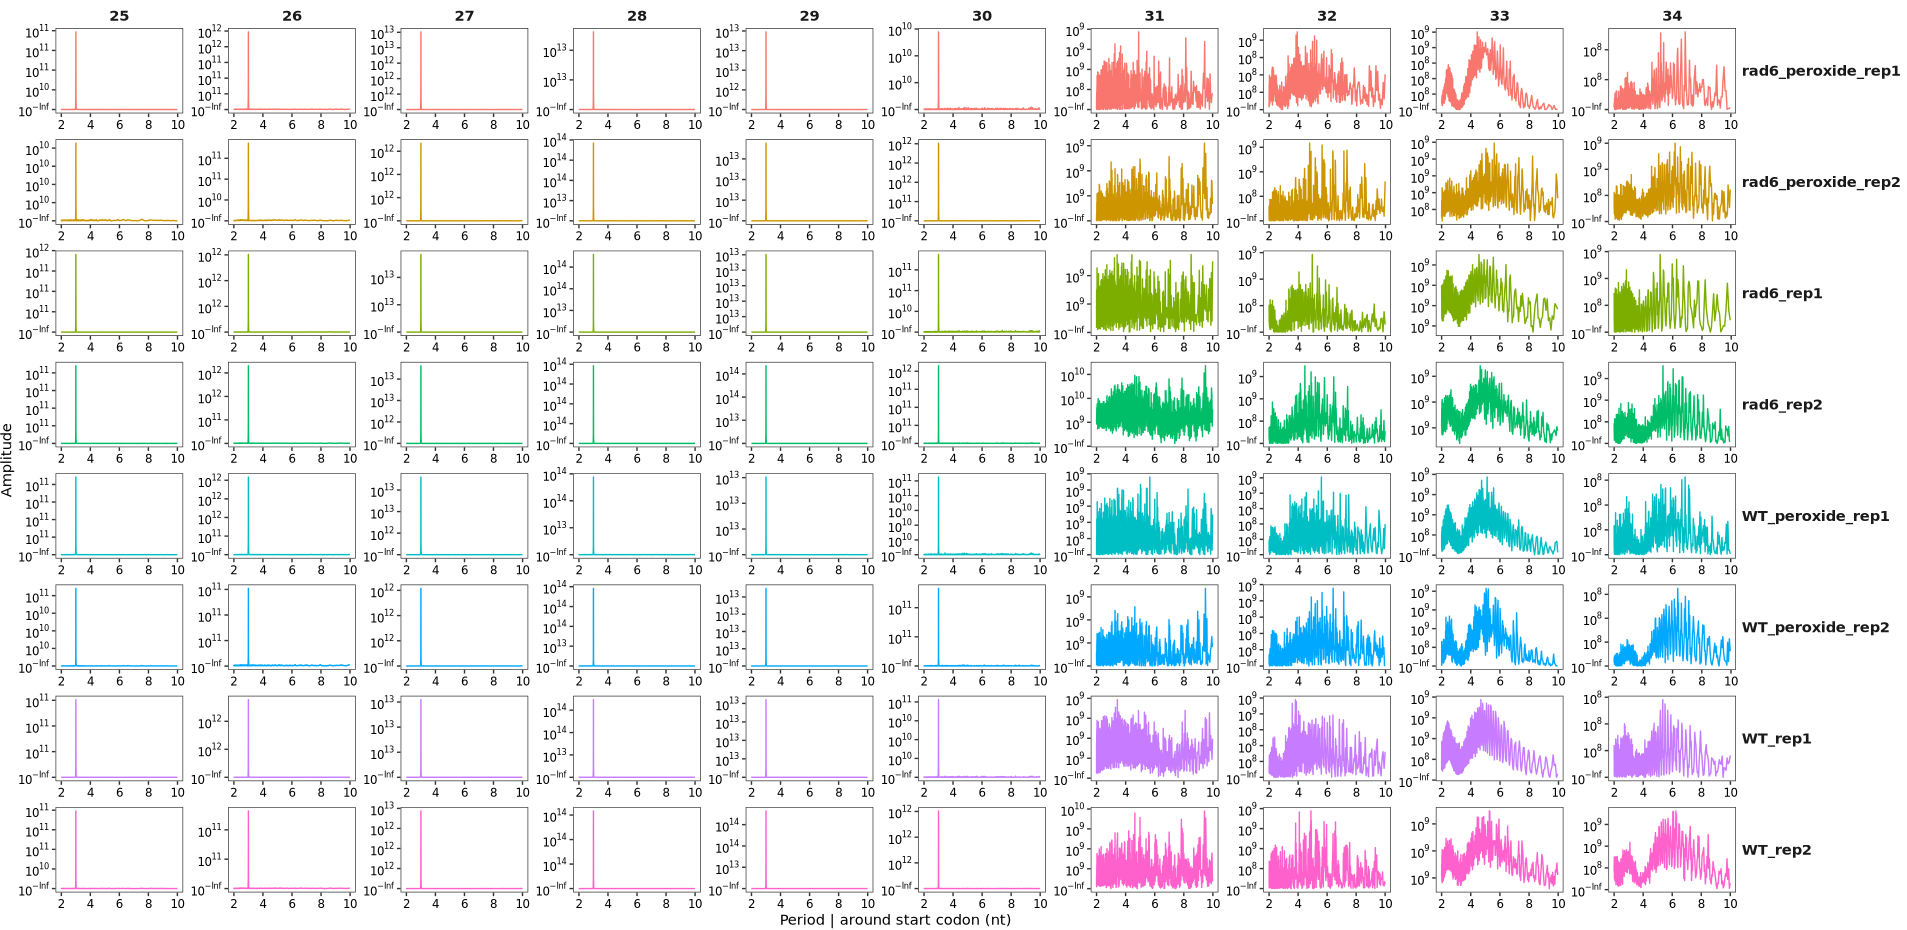
The period_plot function can be used to analyze and visualize the 3-nucleotide (3-nt) periodicity of Ribo-seq reads. In this example, we use the ribo_trans object generated in the “Ubiquitin Conjugase Rad6” section. For details on data processing and object construction, please refer to that section.
By default, the function plots periodicity across all read lengths:
To merge biological replicates before performing the analysis:
period_plot(object = obj,merge_rep = T)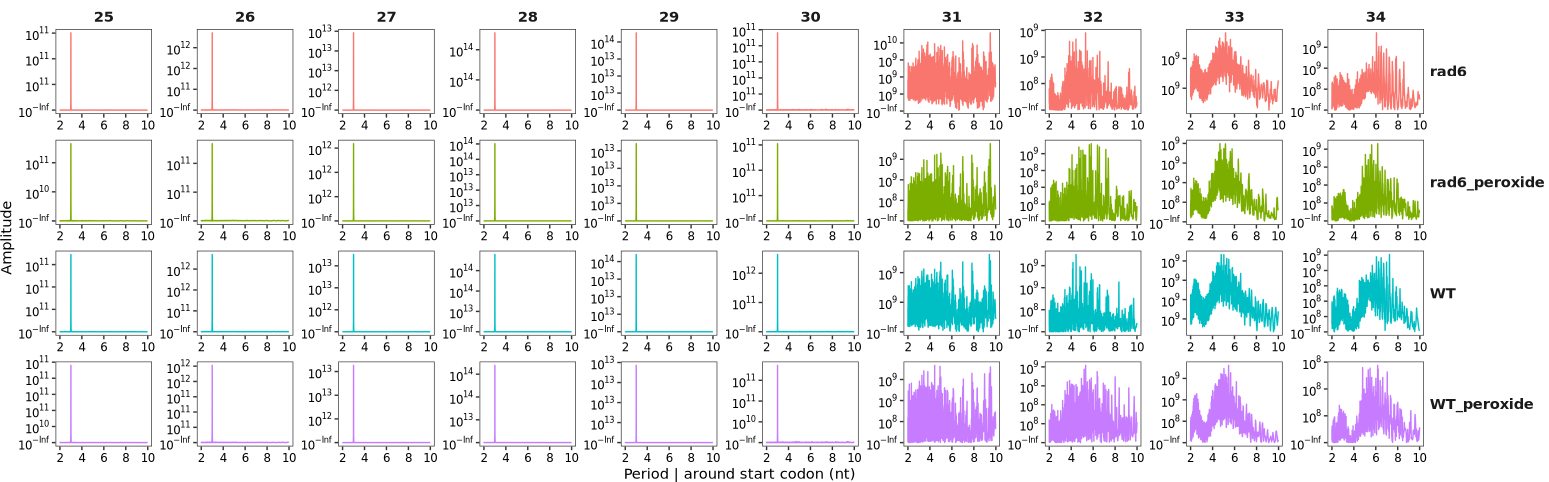
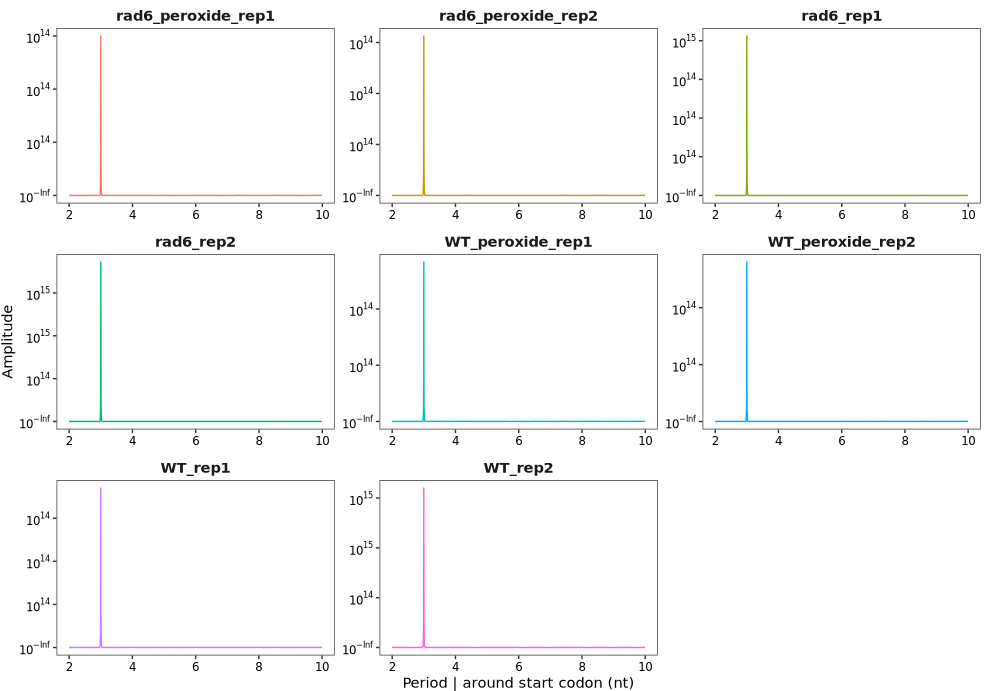
To ignore read-length grouping and show combined periodicity:
period_plot(object = obj,
            group_by_readlength = F)