whole_metagene_plot(object = obj0)10 Whole metegene plot
10.1 Intro
The whole_metagene_plot() function in the riboTransVis package provides an aggregated view of ribosome footprint distribution across all expressed transcripts. It aligns coding regions (CDS), 5′ untranslated regions (5′ UTR), and 3′ untranslated regions (3′ UTR) into a normalized meta-transcript for comparative analysis of ribosome occupancy patterns across conditions or samples.
10.2 How it works
-
Relative Positioning:
The function computes the relative position of ribosome footprints in transcripts, normalized into three regions:- 5′ UTR: [0, 1)
- CDS: [1, 2)
- 3′ UTR: [2, 3)
Rescaling Axis:
The x-axis is rescaled to assign relative sizes to the 5′ and 3′ UTRs based on either auto-scaling from gene features or manually defined scaling.Density Plotting:
A smoothed density plot of ribosome positions is computed across all transcripts and displayed per replicate or per condition.
geom_density_bw (numeric, default = 0.0005): Bandwidth used in estimating the density curve. Smaller values increase resolution but may add noise.
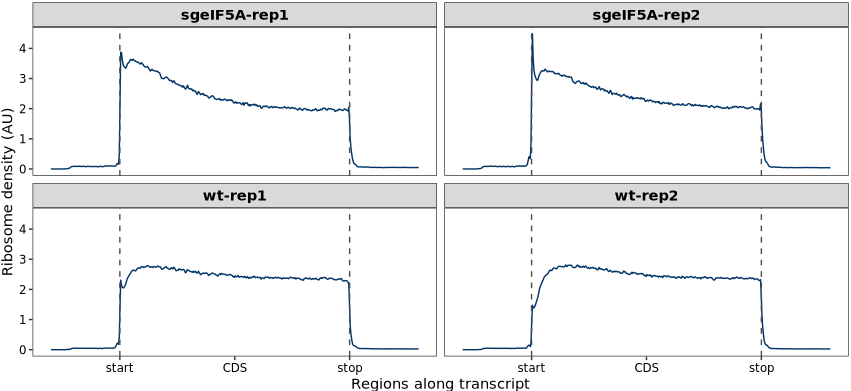
10.3 Example
We now use the whole_metagene_plot function to visualize the distribution of ribosome fragment density across different regions of the transcriptome. This metagene plot aligns all expressed transcripts by their annotated 5′ UTR, coding sequence (CDS), and 3′ UTR regions, enabling a global view of ribosome occupancy patterns: