polarity_plot(obj0)Polarity score
Ribosome profiling (Ribo-seq) captures the positions of ribosomes on mRNAs at nucleotide resolution. The Polarity Score is a metric used to quantify the positional bias of ribosome-protected fragments (RPFs) along the coding sequence (CDS) of transcripts. Specifically, it determines whether ribosomes tend to accumulate more toward the 5′ end or the 3′ end of coding regions during translation.
What does the polarity score tell us?
- A negative polarity score (e.g., -0.2 or lower) indicates that ribosomes are skewed toward the 5′ end of the coding sequence. This may suggest:
- Normal co-translational initiation and early elongation.
- Possible slowdown or pausing at the beginning of ORFs.
- A positive polarity score (e.g., +0.2 or higher) indicates ribosomes accumulate more toward the 3′ end, which may reflect:
- Delayed termination or ribosome stalling near stop codons.
- Translation elongation inefficiency or stress-induced slowdowns.
- A score near zero suggests relatively uniform ribosome distribution along the CDS, often considered a sign of regular translation dynamics.
This metric is commonly used for quality control, sample comparison, and interpretation of mechanistic changes in translation, such as those caused by certain knockdowns or treatments that affect elongation or termination.
Polarity calculation
The polarity score for a given position i can be calculated as:
\[ p_i = \frac{d_i w_i}{\sum_{i=1}^{l} d_i} \tag{1} \]
Where:
\[ w_i = \frac{2i - (l+1)}{l - 1} \tag{2} \]
- \(d_i\) is the ribosome read density at position \(i\).
- \(l\) is the total length along the CDS.
- \(w_i\) defines a scale from -1 at the 5′ end to +1 at the 3′ end.
Effectively, \(w_i\) linearly increases from -1 to +1 across the CDS. The final polarity score is a weighted average of the read densities, reflecting whether RPFs are concentrated at the start or the end of transcripts.
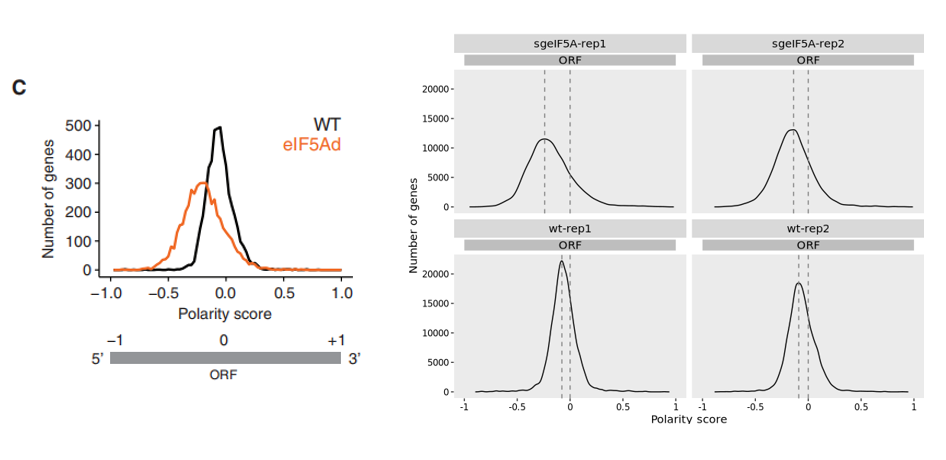
Polarity plot
Using the polarity_plot function, we assessed the ribosome occupancy bias along coding regions. The resulting plot closely recapitulates the findings from the original study. Notably, in the eEIF5A knockout condition, a leftward shift in polarity was observed, reflecting ribosome accumulation toward the 5′ end of mRNAs. This shift implies attenuated translational elongation efficiency relative to wild-type cells, potentially resulting from impaired ribosome progression or pausing early in the CDS:
When return_data = TRUE is set in the polarity_plot() function, the function returns the data used for plotting instead of rendering the figure directly. This allows users to create customized visualizations using their preferred plotting libraries such as ggplot2:
pt <- polarity_plot(obj0, return_data = T)

head(pt)
#            x         y       sample
# 1 -0.9509882 0.1482262 sgeIF5A-rep1
# 2 -0.9472065 0.2133719 sgeIF5A-rep1
# 3 -0.9434249 0.3019287 sgeIF5A-rep1
# 4 -0.9396433 0.4201396 sgeIF5A-rep1
# 5 -0.9358616 0.5751527 sgeIF5A-rep1
# 6 -0.9320800 0.7749276 sgeIF5A-rep1
# ...