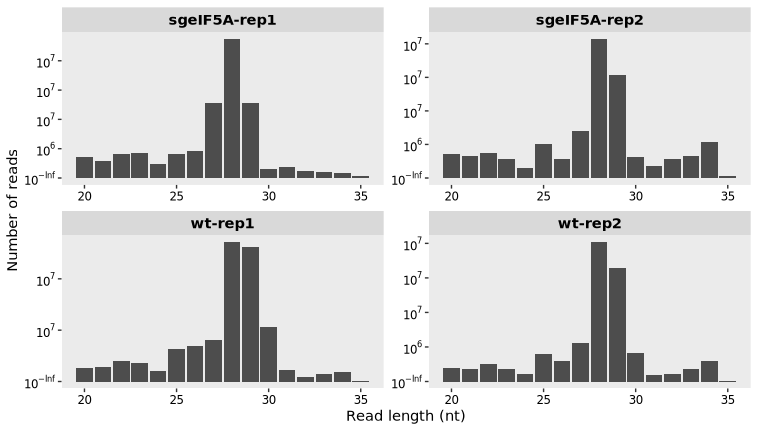
length_plot(obj0)4 Length distribution
4.1 Introduction
The length_plot() function is used to visualize the distribution of read lengths in Ribo-seq data, an important metric for quality assessment. In a successful Ribo-seq experiment, most reads—referred to as ribosome-protected fragments (RPFs)—typically fall within a narrow length range (e.g., 28–30 nucleotides) corresponding to the size of the ribosome footprint.
By plotting the read length distribution, users can:
Confirm the presence of a dominant RPF length.
Detect potential contamination (non-specific fragments).
Adjust downstream analysis parameters, such as read-length selection for P-site calibration and metagene profiling.
A well-shaped length distribution plot with distinct peaks at expected sizes generally indicates high-quality digestion and successful capture of translating ribosomes.
By specifying type = “frame_length”, the function generates a frame-resolved read length distribution plot. The overlaid numbers represent the proportion of reads in frame 0 for each read length, assisting in the identification of lengths with strong 3-nt periodicity:
length_plot(obj0,type = "frame_length")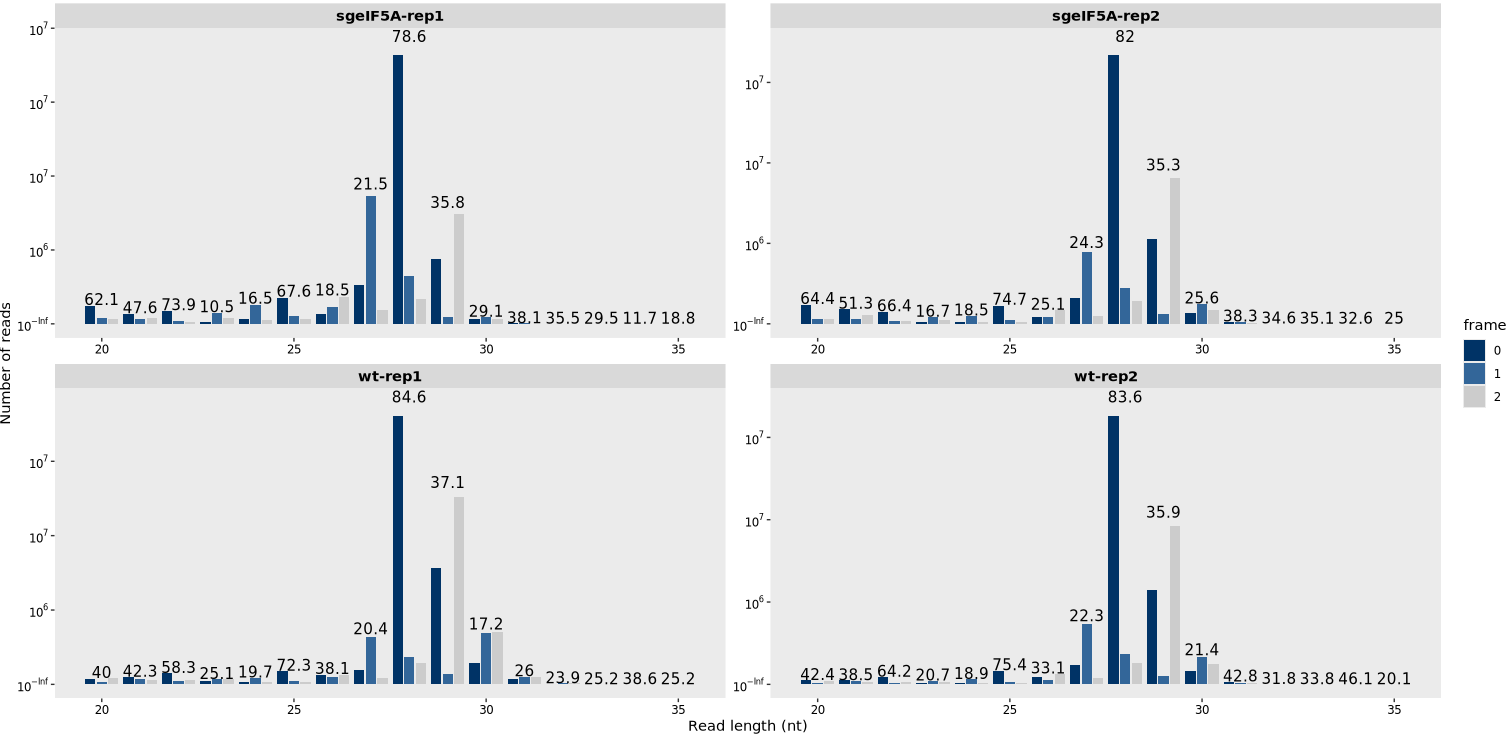
If you do not wish to display the frame 0 periodicity, you can disable it by setting add_periodicity_label = FALSE.