relative_dist_plot(obj0)8 Meta frame plot
8.1 Intro
The relative_dist_plot() function visualizes the positional distribution of ribosome-protected fragments (RPFs) relative to either the start codon or stop codon within annotated coding sequences (CDS). This plot reveals the 3-nt periodicity of translating ribosomes and can be used to assess the overall translational signature and framing around translation initiation and termination sites.
8.1.1 What It Does
This function produces barplots showing the distribution of RPFs relative to start or stop codons. Each bar indicates the count of reads at a given position (x = rel), grouped and colored by frame (0, 1, 2). The frame is calculated as (position - mstart_or_mstop) %% 3.
8.2 Plot
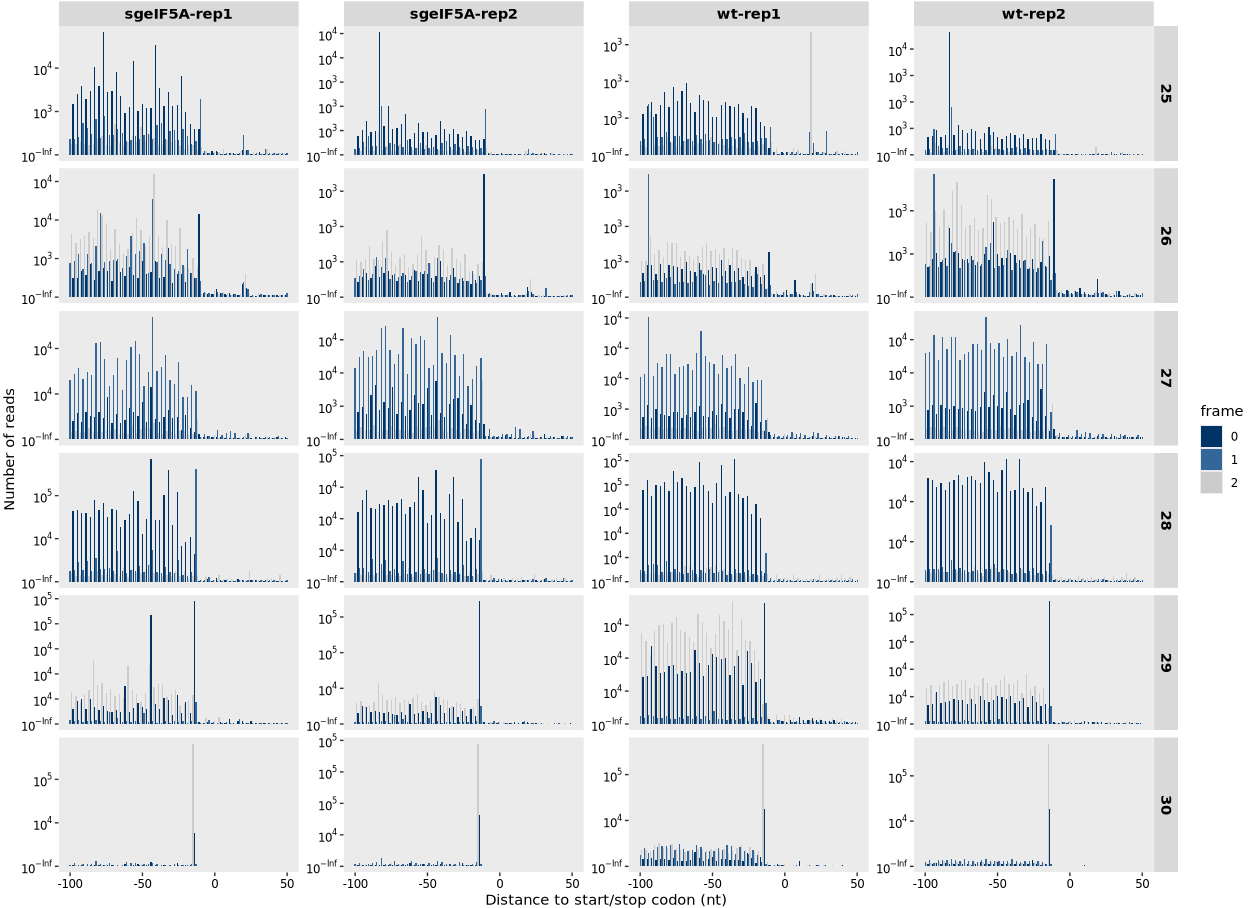
A periodic signal beginning ~+12 nt from the start codon suggests correct P-site assignment and genuine ribosome footprints:
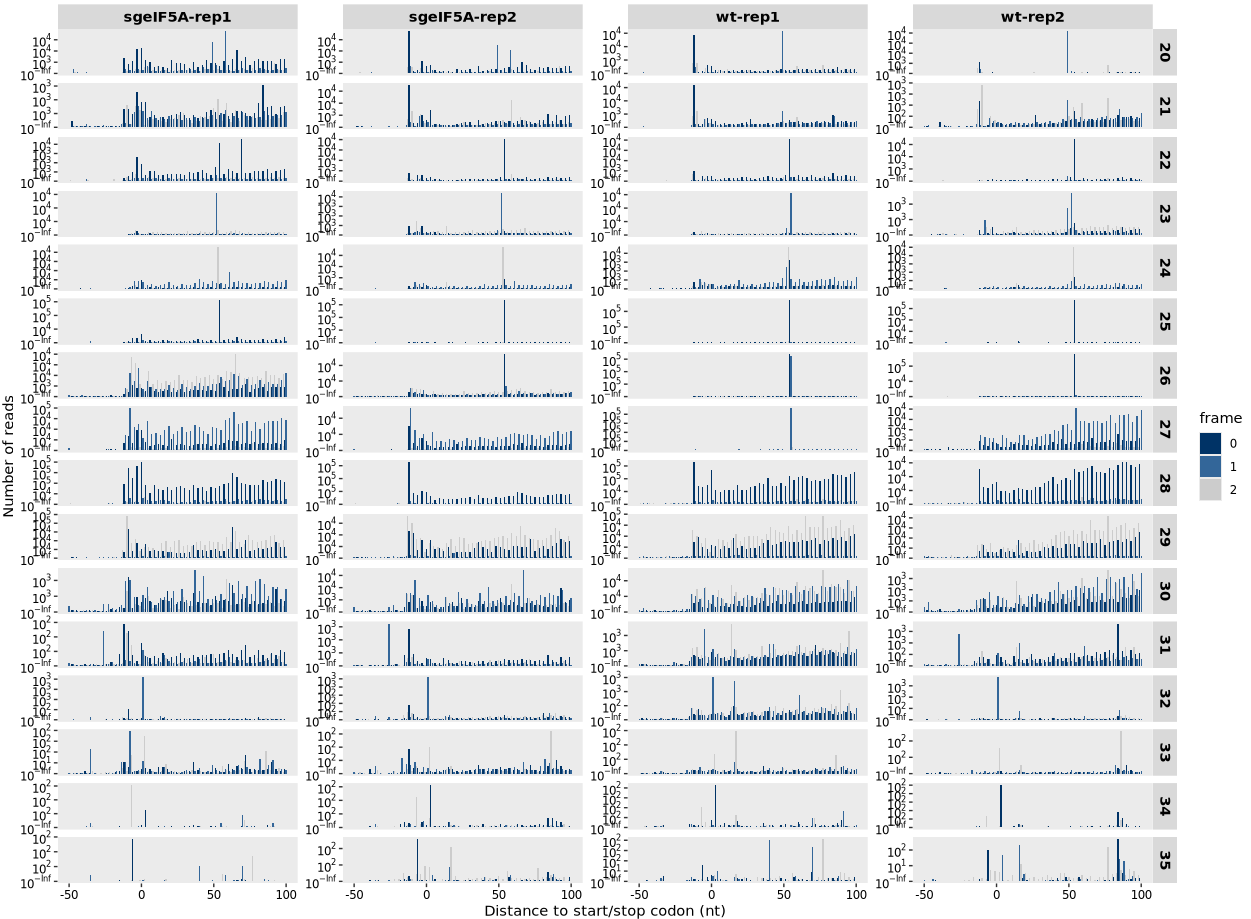
The read_length parameter allows users to specify the range of fragment sizes (in nucleotides) to include in the plot. This is useful for focusing on canonical ribosome-protected fragment (RPF) sizes—typically ~28–32 nt—while excluding shorter or longer reads that may arise from noise or non-ribosomal sources:
relative_dist_plot(obj0,read_length = c(25, 30))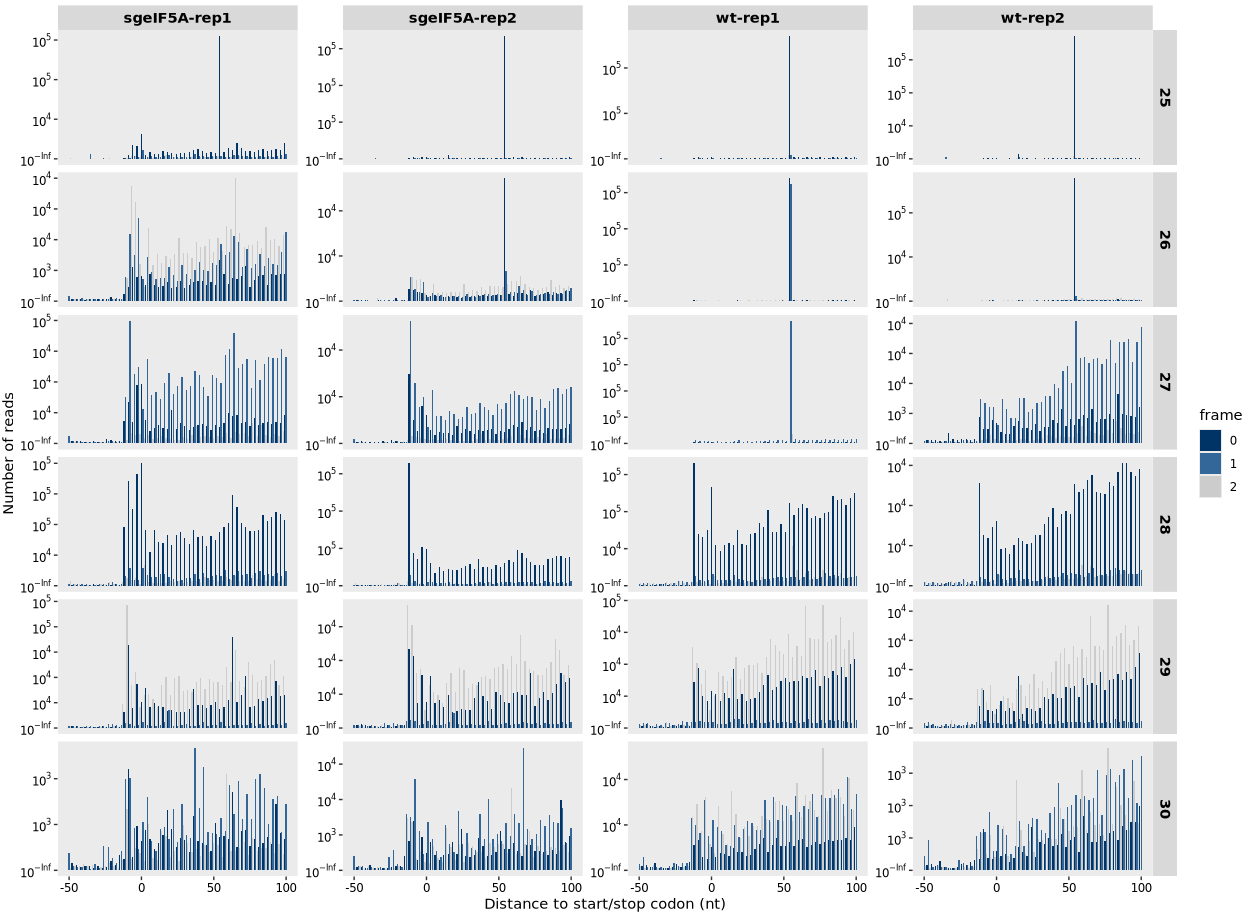
8.2.1 To generate heatmap centered on stop codon:
relative_dist_plot(obj0,
                   type = "rel2stop",
                   read_length = c(25, 30))