get_transcript_sequence(genome_file = "../../index-data/Saccharomyces_cerevisiae.R64-1-1.dna.toplevel.fa",
                        gtf_file = "../../index-data/Saccharomyces_cerevisiae.R64-1-1.112.gtf",
                        feature = "exon",
                        extend = T,
                        extend_upstream = 50,
                        extend_downstream = 50,
output_file = "sac_trans.fa")Enzyme digestion site
Intro
In ribosome profiling (Ribo-seq), enzyme digestion is a critical step that generates the footprints (typically 26–34 nt) for ribosome-bound mRNA fragments. Different nucleases (e.g., RNase I, micrococcal nuclease, or RelE) may have distinct cleavage preferences, producing digestion products that carry sequence biases near the cleavage (digestion) site. Analyzing these sequence preferences helps understand the enzymatic sequence specificity, the bias introduced during library preparation, and enables optimization of experimental protocols.
To investigate the preferences of different nucleases at digestion sites, one commonly extracts sequences flanking either the 5′ or 3′ end of Ribo-seq reads, depending on the experiment design and the library preparation strategy. These site-flanking sequences can be analyzed via motif visualization tools to identify enriched or depleted nucleotides around digest ends.
Cleavage site motif analysis
First, we need to prepare the transcript sequences for all genes:
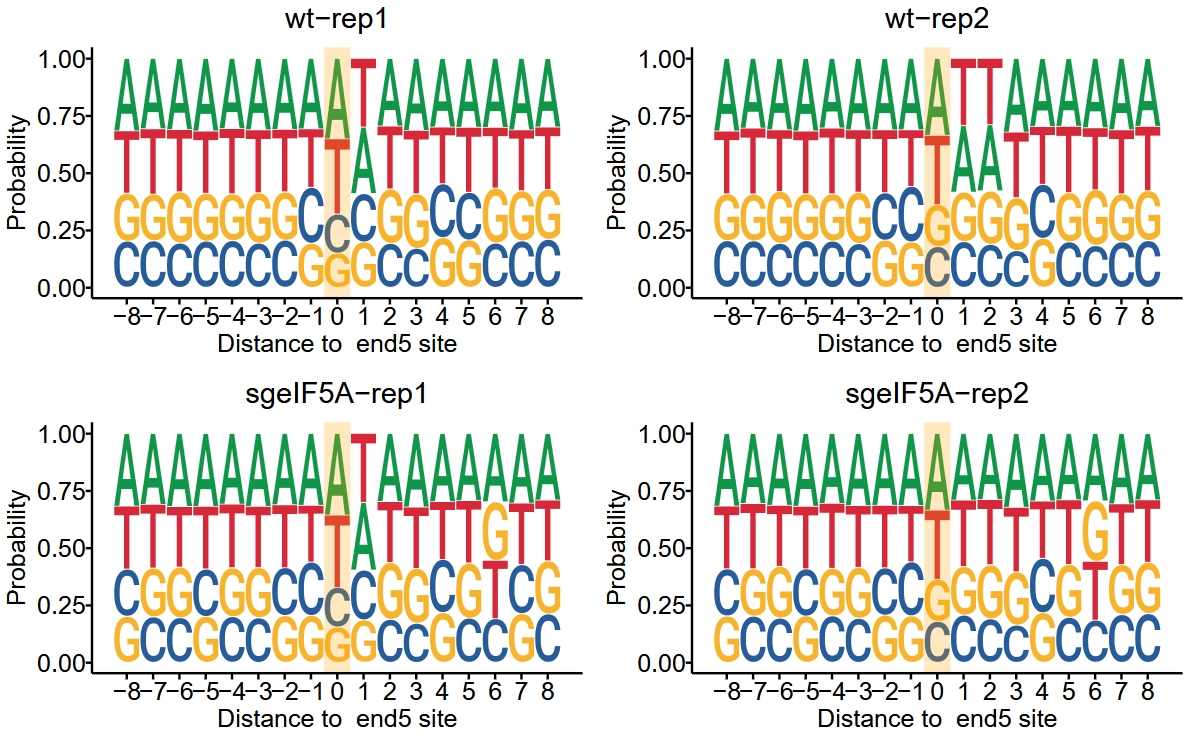
The function digestion_site_plot is used to extract the nucleotide sequences surrounding the 5′ or 3′ ends of all reads, and to visualize motif enrichment around cleavage sites:
dp <- digestion_site_plot(object = obj0,
                          transcript_fa = "sac_trans.fa",
                          type = "end5")
The result returned is a list of ggplot objects:
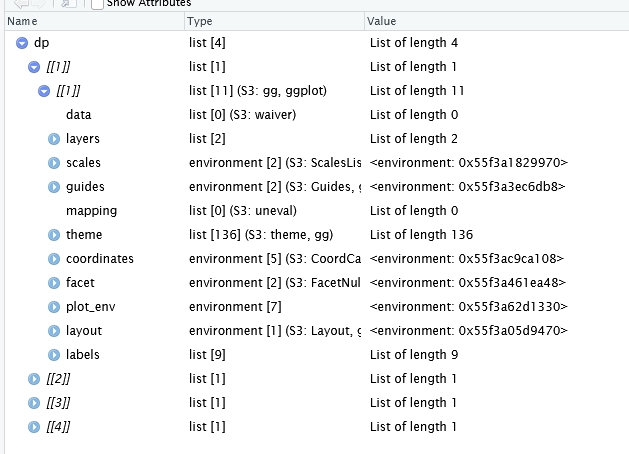
Motif plot:
We can also visualize the sequence context of cleavage sites corresponding to reads in different reading frames (frame 0, 1, 2):
dp2 <- digestion_site_plot(object = obj0,
                           transcript_fa = "sac_trans.fa",
                           type = "end5",
                           show_frame = T)

library(patchwork)

do.call(cowplot::plot_grid, args = c(list(ncol = 1),sapply(dp2,"[",1))) +
  do.call(cowplot::plot_grid, args = c(list(ncol = 1),sapply(dp2,"[",2))) +
  do.call(cowplot::plot_grid, args = c(list(ncol = 1),sapply(dp2,"[",3)))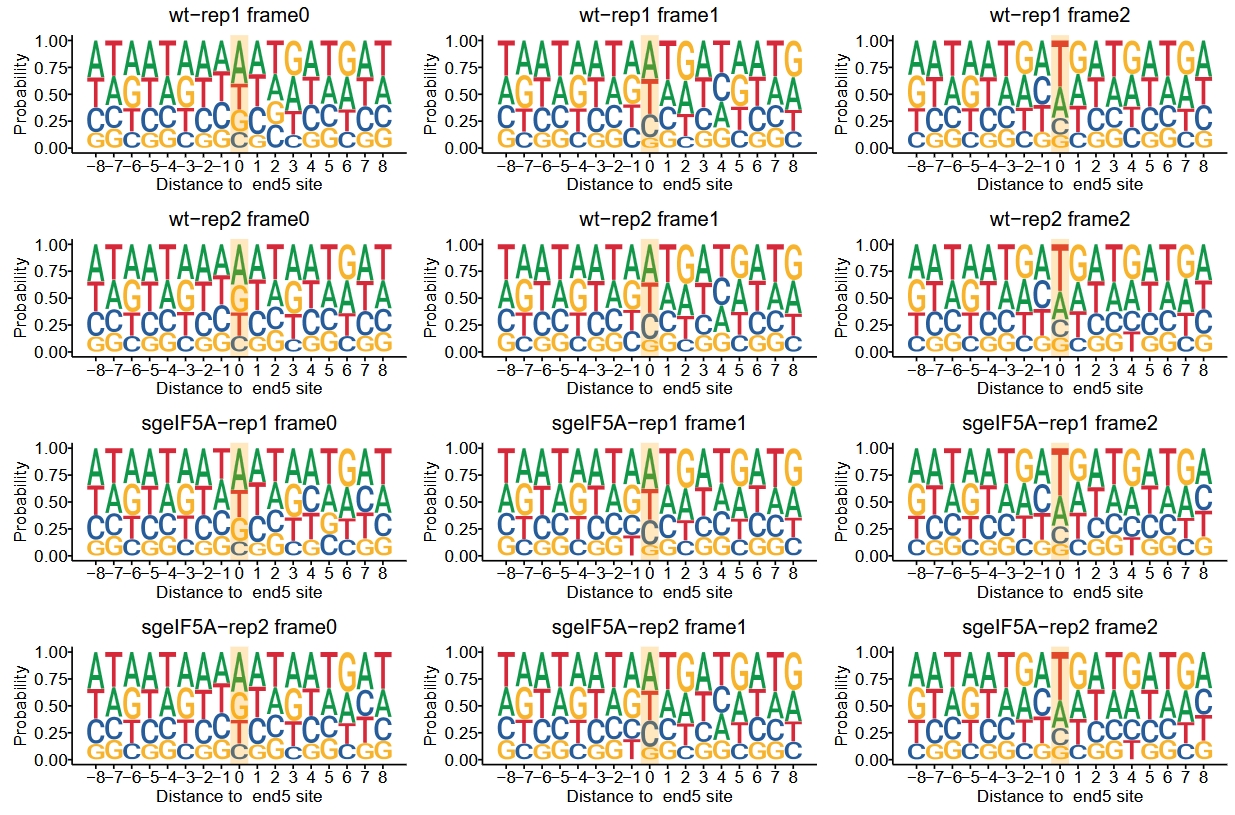
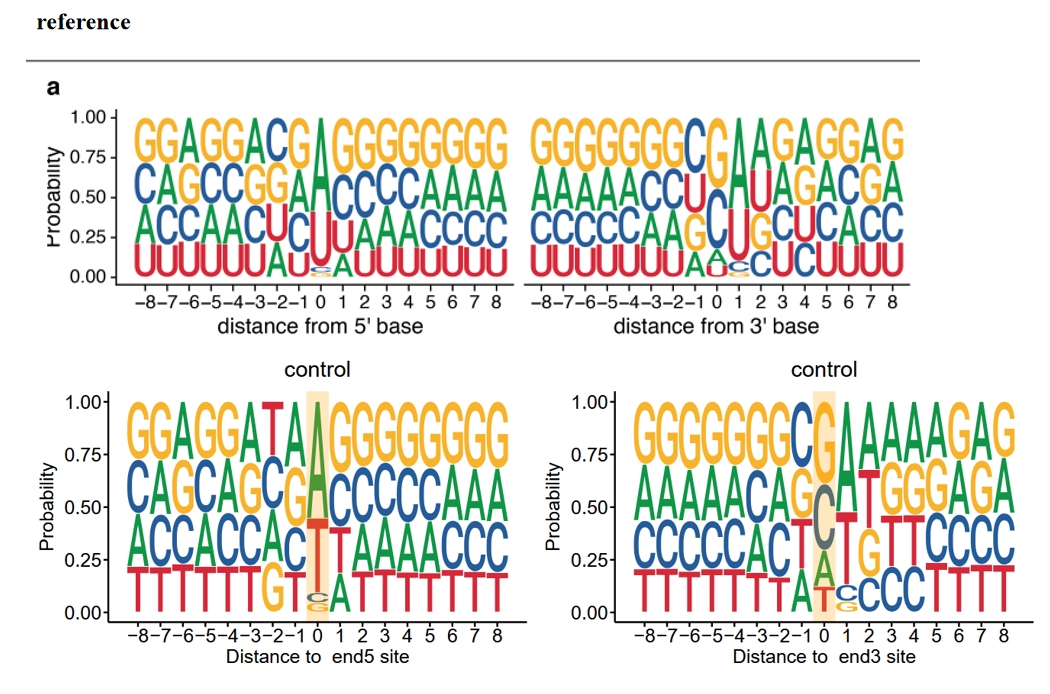
To visualize the motif surrounding the 3′ end of footprint reads using the bits method:
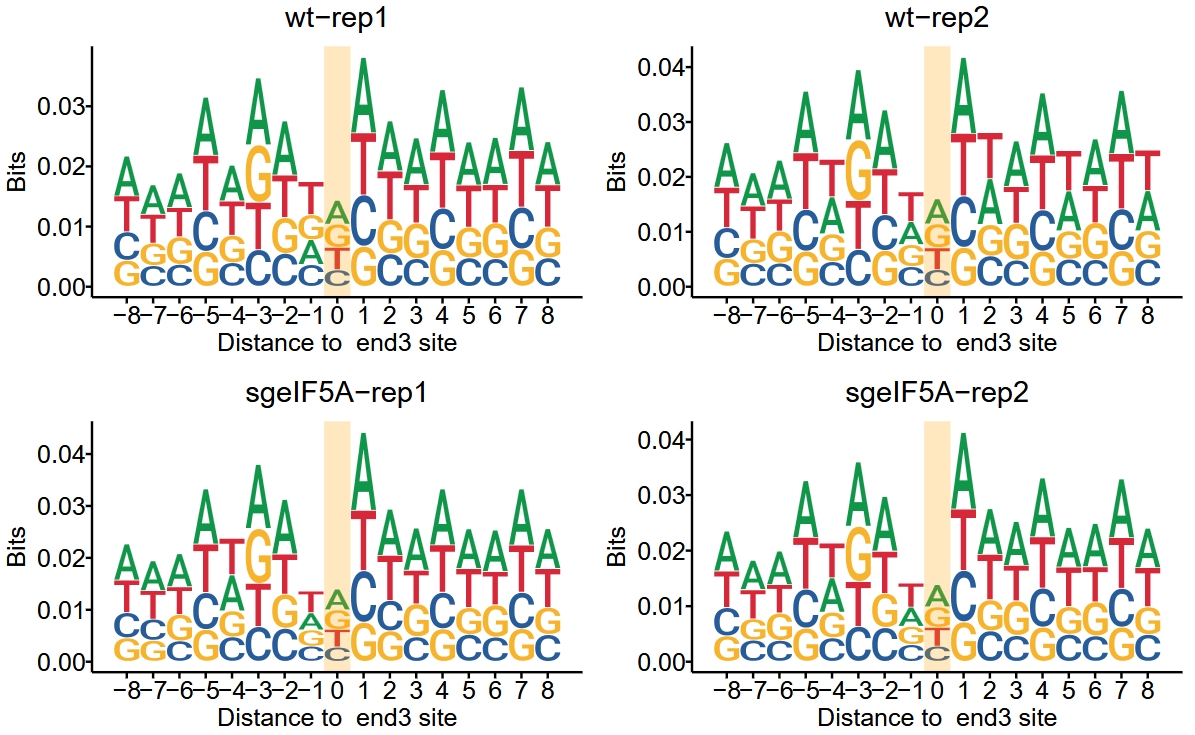
There is no obvious sequence preference at the cleavage sites of ribosome-protected fragments treated with RNase I. In contrast, the fragments treated with MNase show a clear sequence preference, particularly for A/U bases. The data is from “Single-cell Ribo-seq reveals cell cycle-dependent translational pausing”:
get_transcript_sequence(genome_file = "../../index-data/Homo_sapiens.GRCh38.dna.primary_assembly.fa",
                        gtf_file = "../../index-data/Homo_sapiens.GRCh38.112.gtf",
                        feature = "exon",
                        output_file = "GRCh38_trans.fa")

dp5 <- digestion_site_plot(object = obj,
                          transcript_fa = "GRCh38_trans.fa",
                          type = "end5")

dp3 <- digestion_site_plot(object = obj,
                          transcript_fa = "GRCh38_trans.fa",
                          type = "end3")

library(patchwork)

p5 <- sapply(dp5,"[",1)
p3 <- sapply(dp3,"[",1)

p5[[1]] + p3[[1]]