relative_heatmap_plot(obj0)9 Meta heatmap plot
9.1 Heatmap of read distribution relative to start/stop Codons
9.1.1 Translational landscape around start/stop Sites
In Ribo-seq analysis, visualizing how ribosome footprints (RPFs) are distributed around translation start and stop codons provides valuable insights into translation initiation and termination dynamics. One common approach is to summarize read density by both position and fragment length (read width), and display it as a heatmap centered on CDS boundaries.
9.1.2 What Does the Heatmap Show?
The relative_heatmap_plot() function generates a two-dimensional heatmap showing the abundance of RPFs aligned relative to either:
The start codon (type = “rel2start”), or
The stop codon (type = “rel2stop”)
The heatmap shows:
X-axis: Relative distance from start/stop codon in nucleotides
Y-axis: Read length (fragment size in nt)
Color scale: Read count (optionally log-scaled)
This enables quick inspection of read length distributions and framing periodicity near initiation and termination sites across all samples.
9.1.3 Function usage
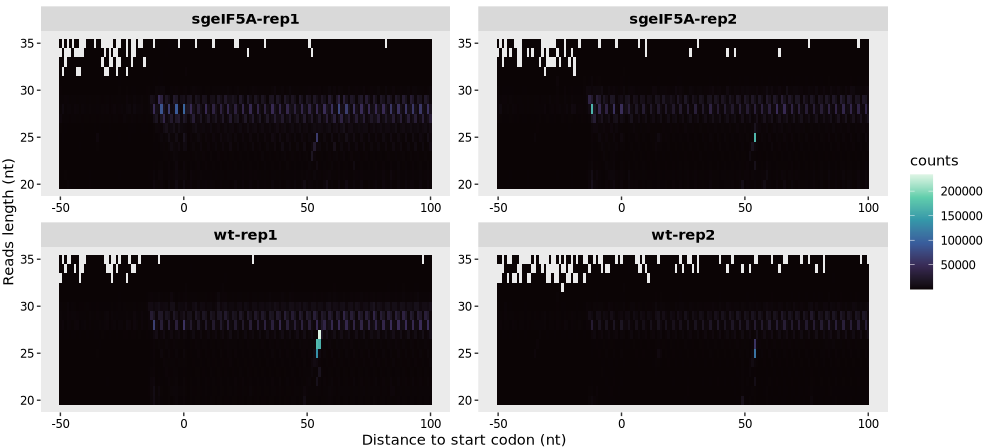
9.1.4 To generate heatmap centered on start codon:
9.1.5 Enhancing visualization of low-abundance reads
The log_scale argument allows you to apply a log2 transformation to the read counts in the heatmap:
relative_heatmap_plot(obj0,log_scale = T)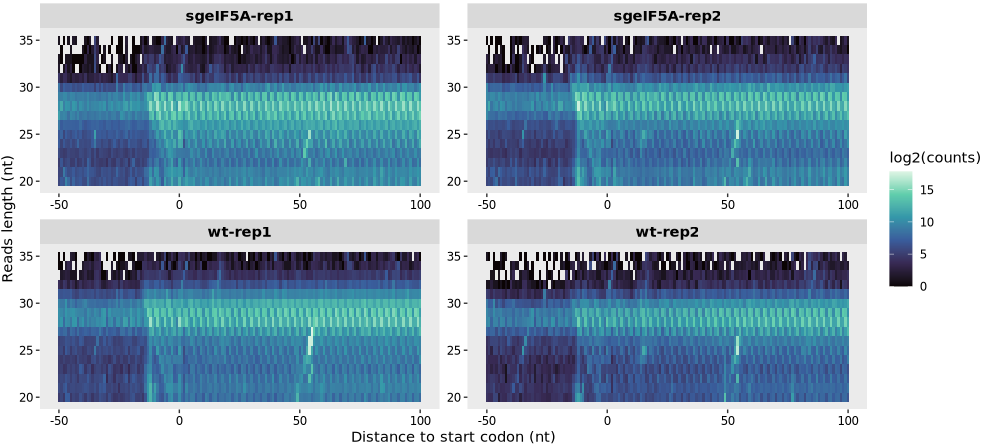
9.1.6 Interpreting the heatmap
A strong signal centered at positions ~+12 nt indicates high-quality P-site calibration (distance is measured from codon to footprint center/P-site).
Enrichment for canonical read lengths (e.g., 28–30 nt in eukaryotes) indicates expected ribosomal protection.
A vertical “stripe” of strong signal for a specific fragment size suggests dominant ribosome-protected fragments.
If log_scale = TRUE, low-abundance signals can be visualized more clearly.
Note: This heatmap is a powerful diagnostic tool for detecting irregularities in read size distribution, impaired library prep, or incorrect P-site offset settings.
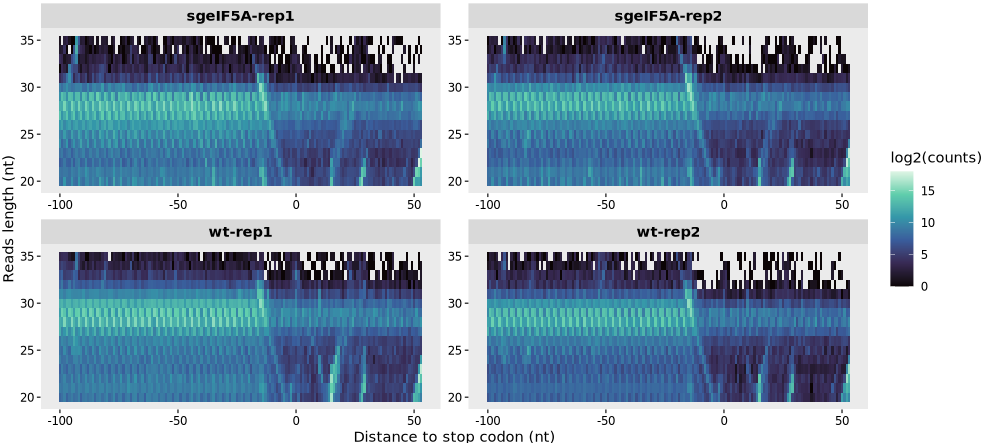
9.1.7 To generate heatmap centered on stop codon:
relative_heatmap_plot(obj0,
                      type = "rel2stop",
                      log_scale = T)